Tag: tax revenue

  • Exploring City Revenues: A Beginner’s Guide with CityFinance.in

    Exploring City Revenues: A Beginner’s Guide with CityFinance.in

    This Total Revenue Primer marks the first edition in a multi-part series on the financial data of cities hosted on CityFinance.in. Each edition in the series will spotlight one key fiscal indicator, offering a focused analysis to demonstrate the different kinds of insights that can be drawn from the data and how they inform a deeper understanding of urban finance. This initiative aims to foster greater understanding and engagement with financial data of Indian cities, enabling deeper analysis and research in this critical area. 

    Total revenue refers to the aggregate income a city receives from all sources. Major sources of a city’s revenue include tax revenue, non-tax revenue, assigned revenues, and intergovernmental grants from both state and central governments.

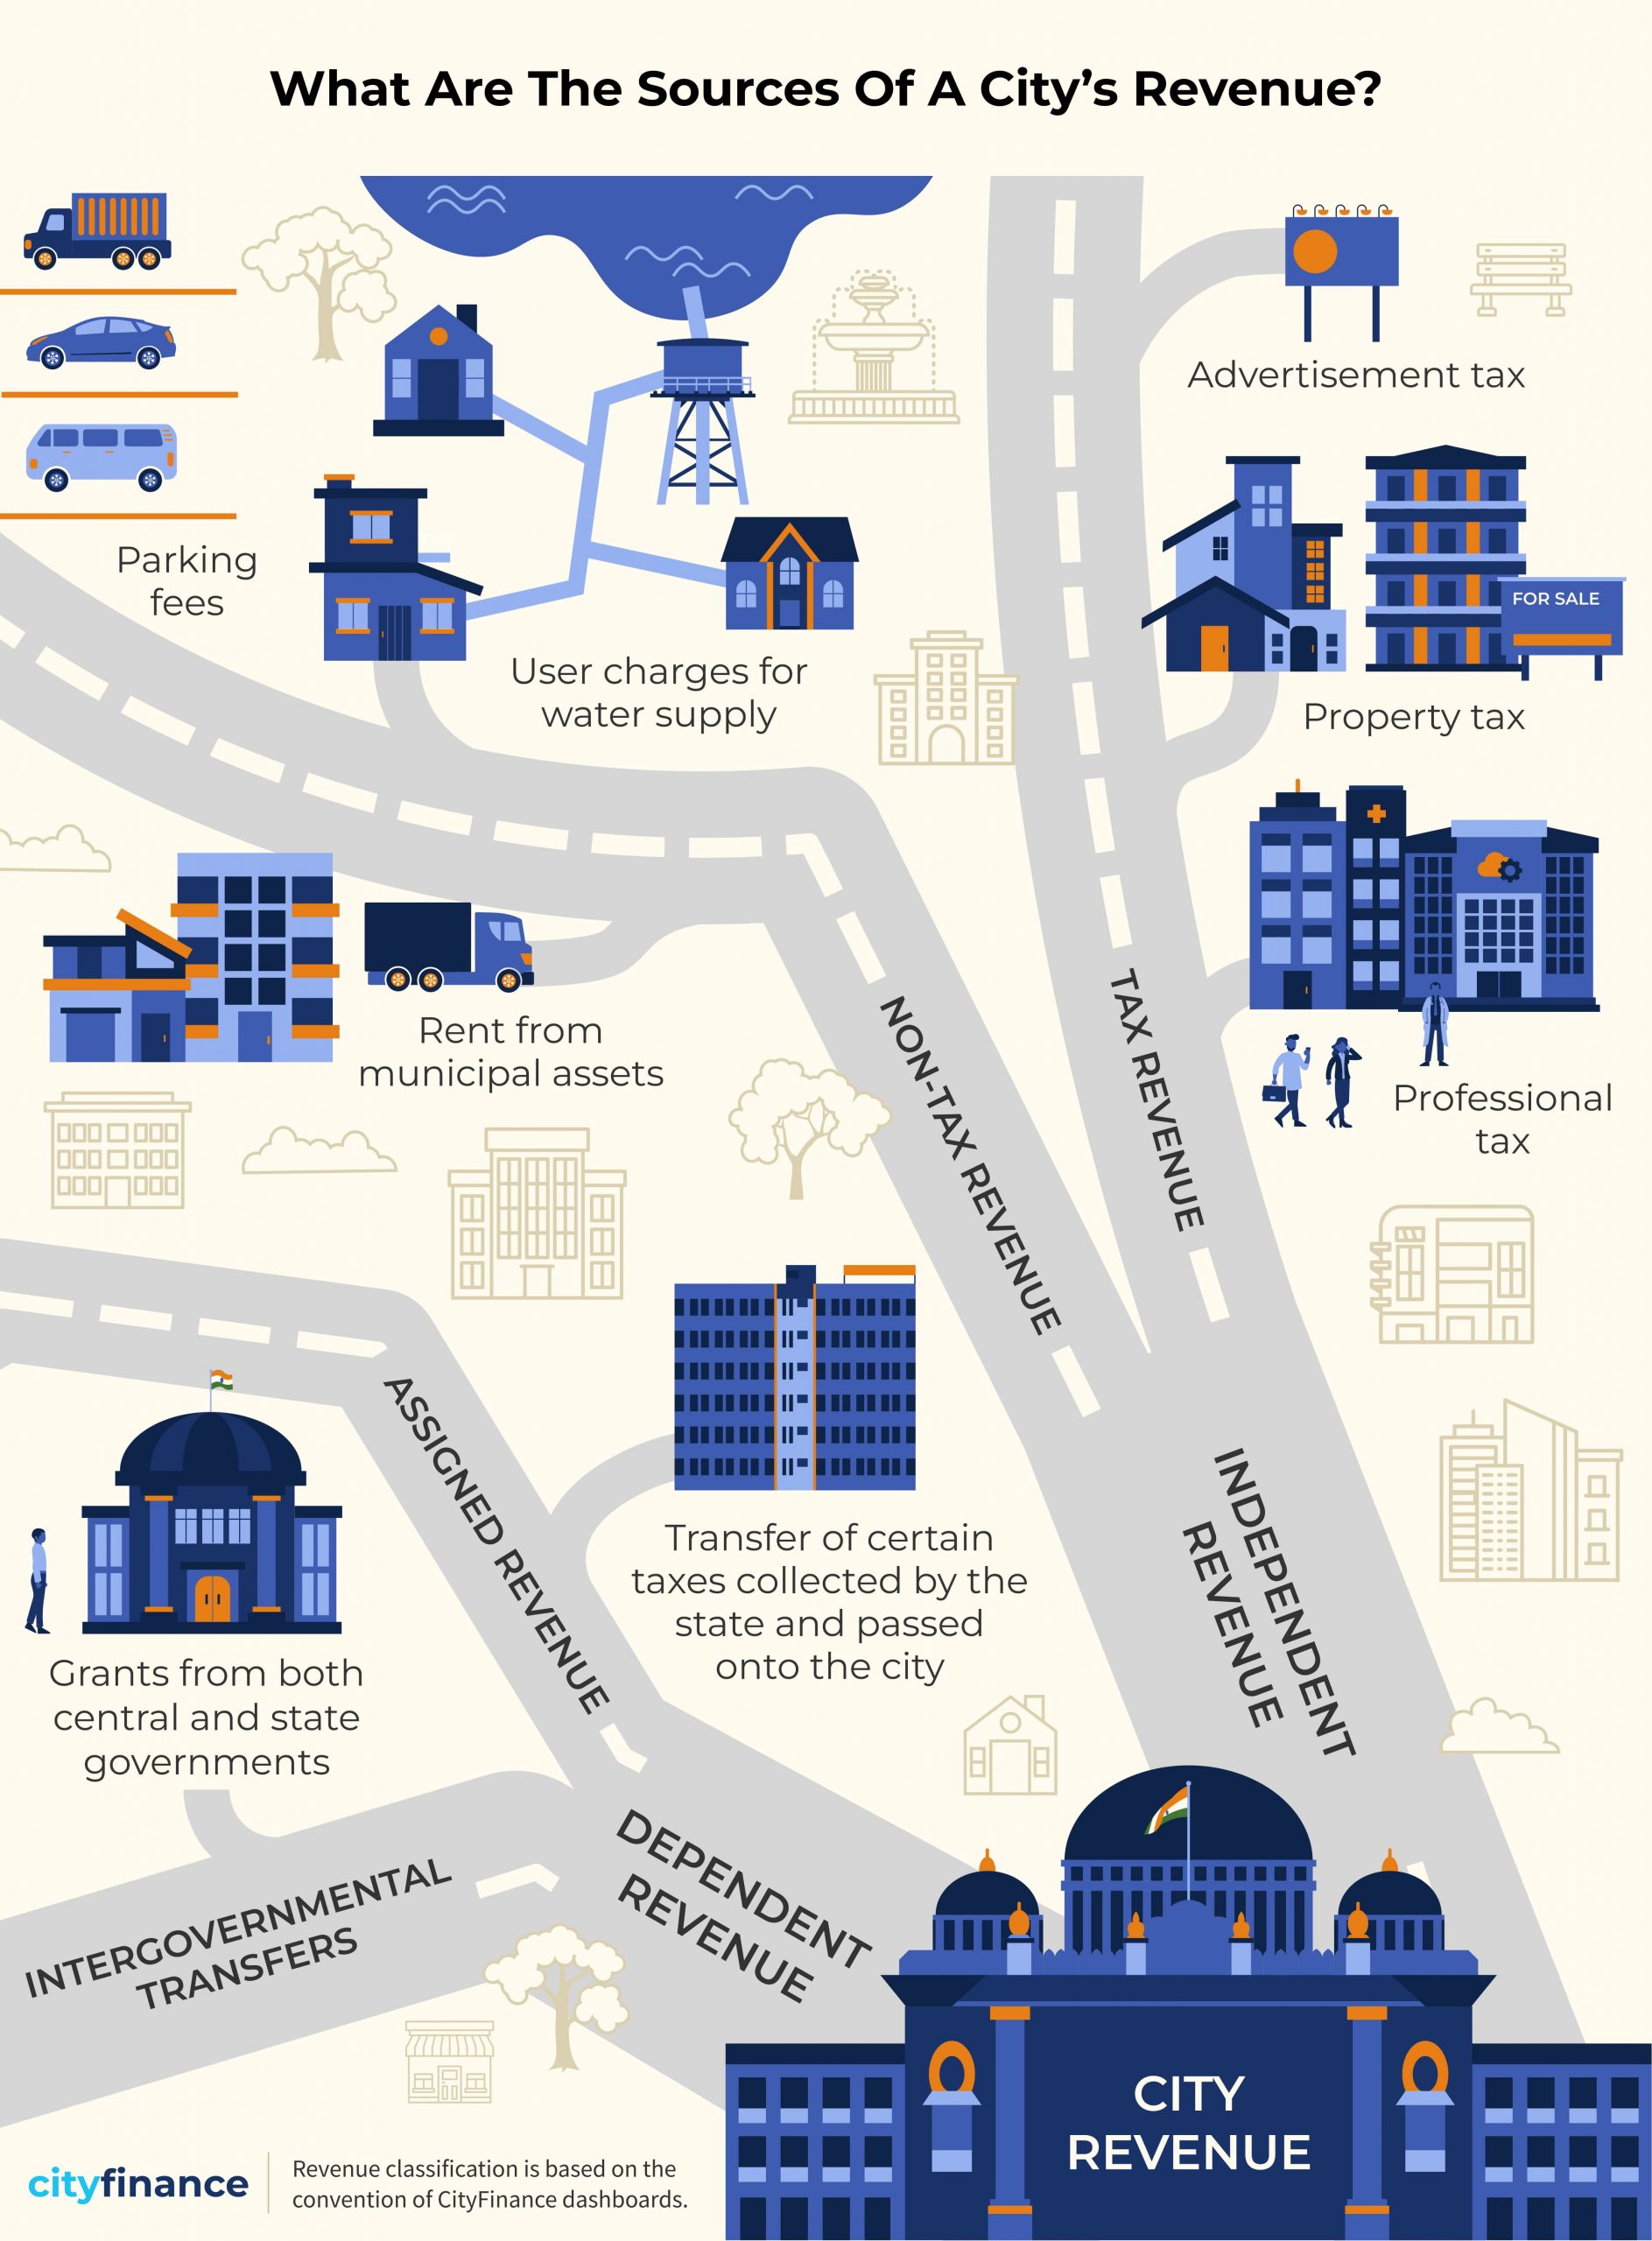
    Together, these streams form the financial backbone that supports a city’s operations and development initiatives. 


    Rising Revenues, Widening Revenue Gaps 

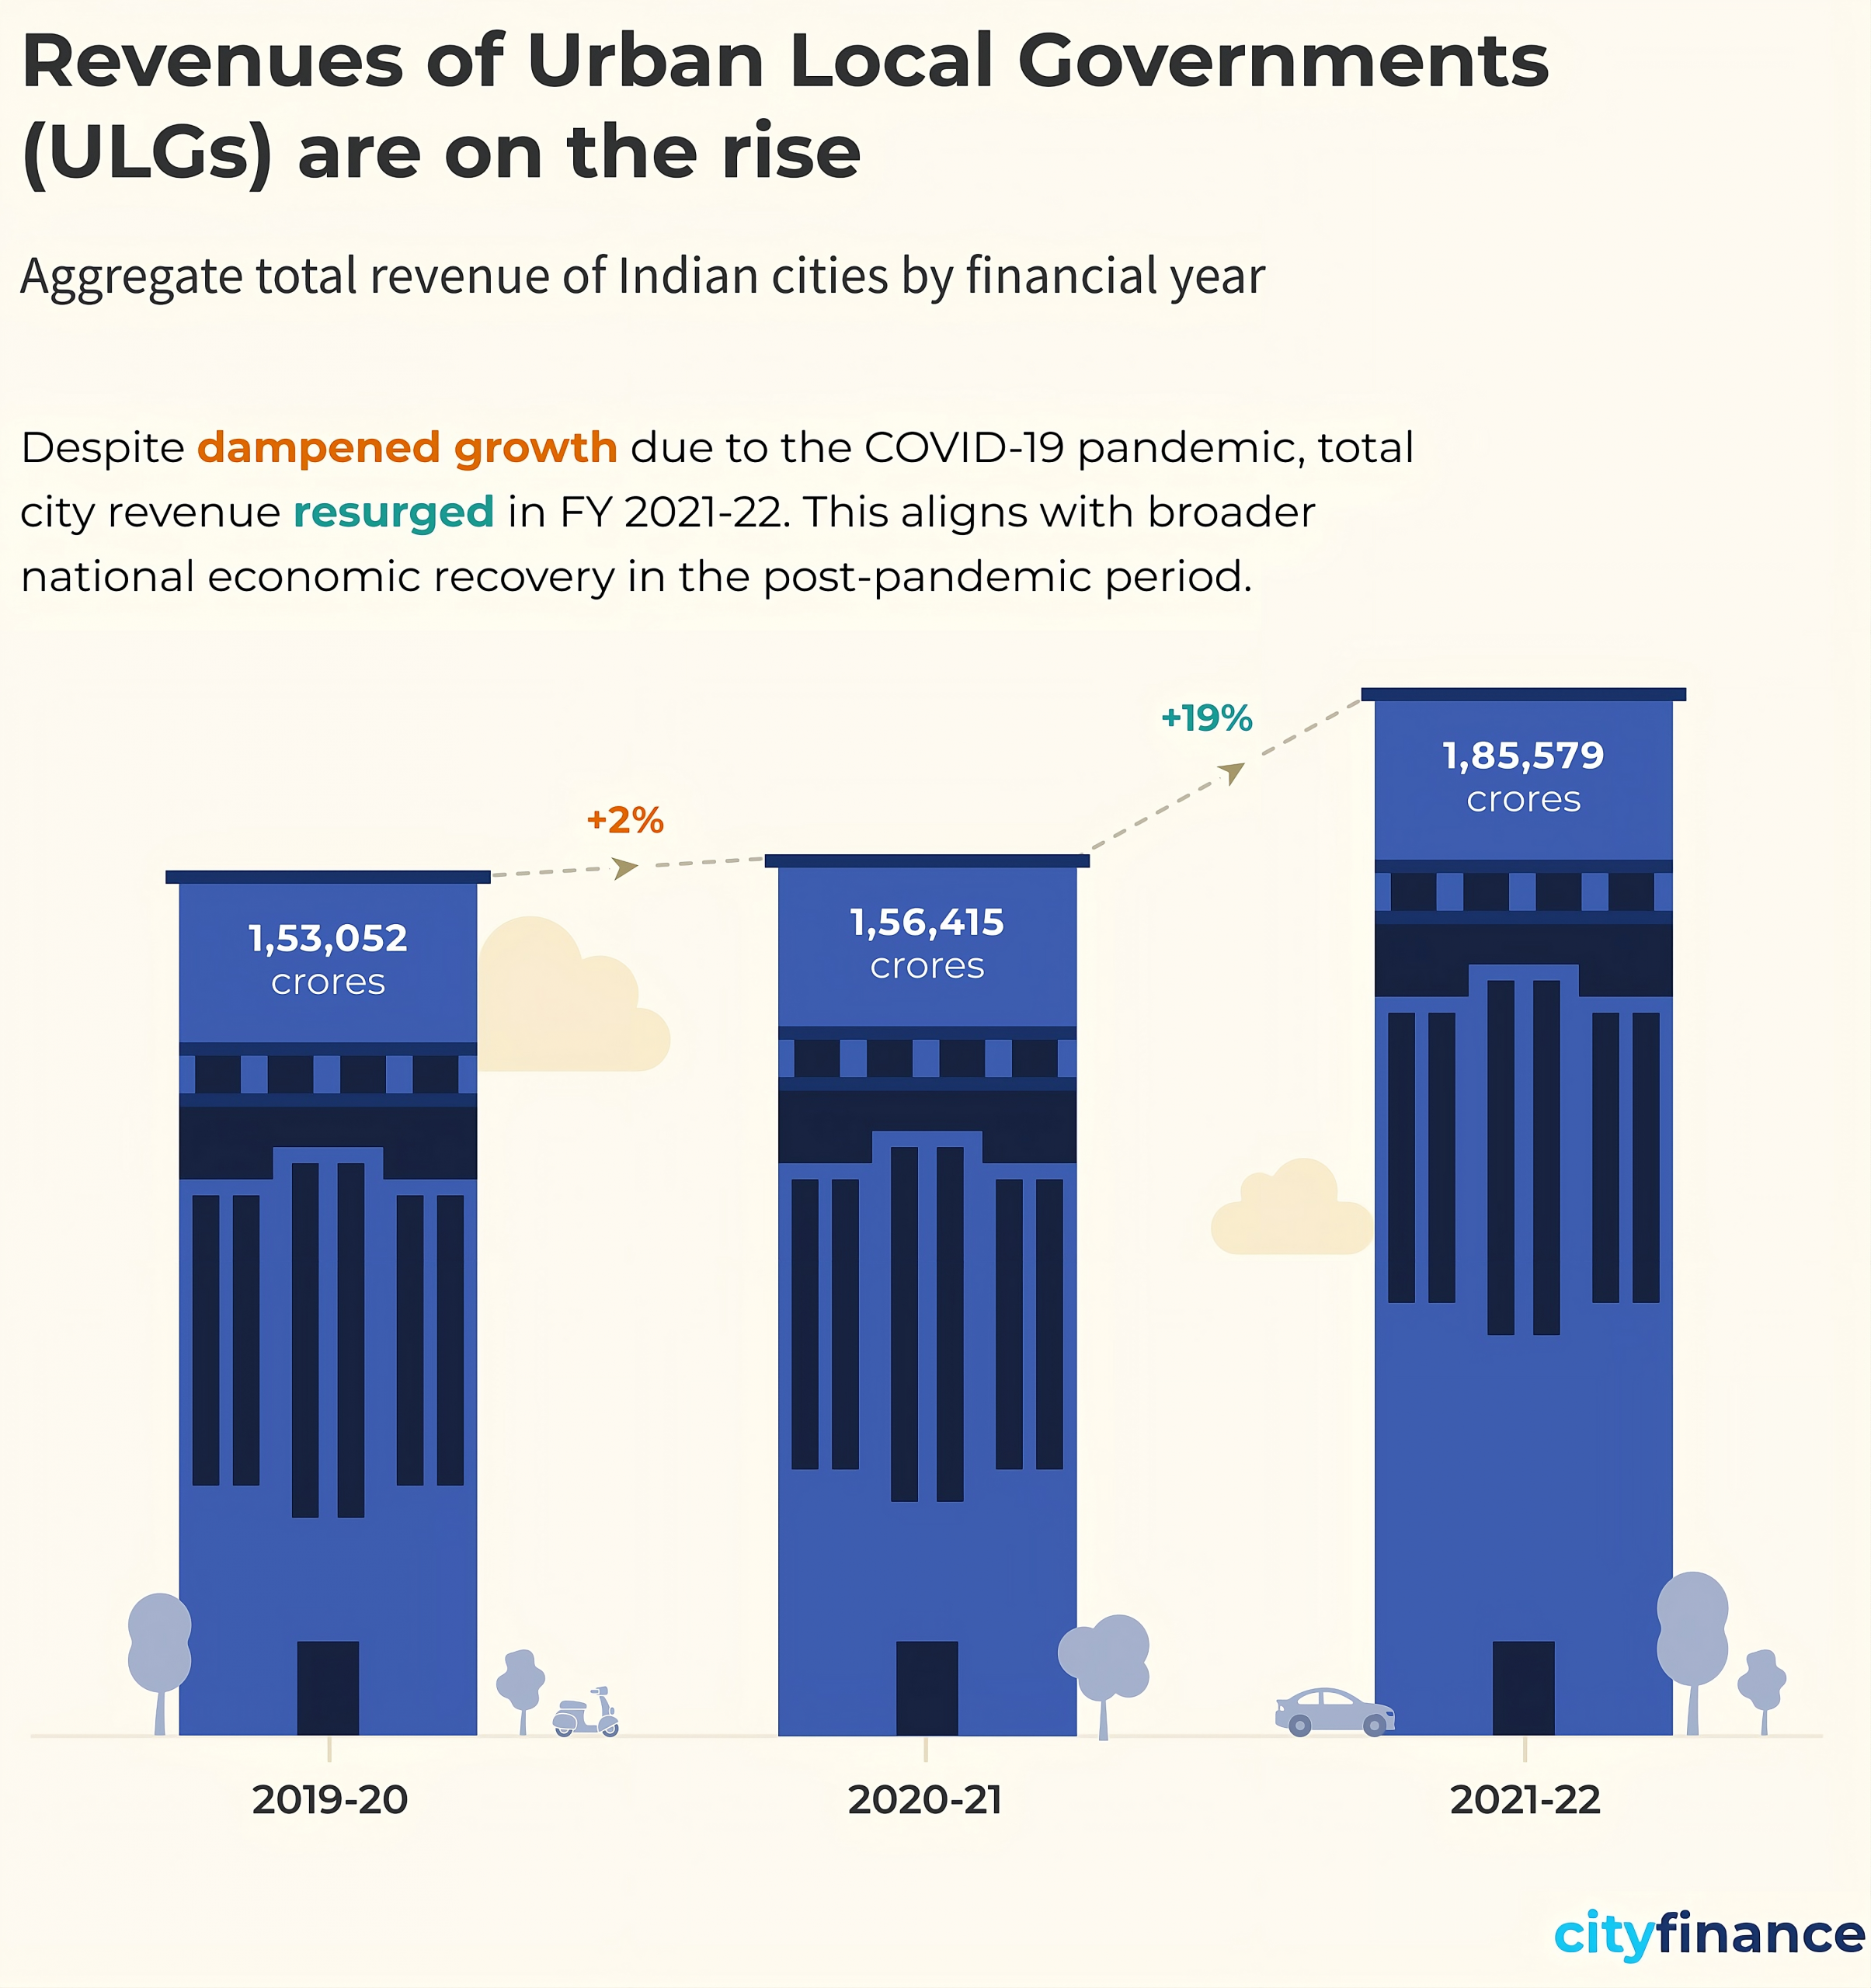
    Revenues of Urban Local Governments (ULGs) are rising across India, reflecting positive economic growth. However, this increase is far from uniform, with significant disparities emerging between cities.  

    As we see in the chart above, the 7 cities that serve 17% of the urban population of India report the largest share of receipts at 42%. In comparison, 3,374 cities that serve 41% of India’s urban residents form just 16% of total revenue. Could bigger cities simply have higher revenue because of their larger population base, or does the trend hold even when we look at per capita revenue? Let us examine. 

    Larger cities generate significantly more revenue per person, with cities in the 4 million plus population category collecting ₹15,542 per capita – nearly twice the next population category. This indicates that the revenue advantage of larger cities is not simply due to their larger population base but reflects genuinely higher per capita economic activity and tax collection capacity. 

    Growth rates (2020-21 to 2021-22) tell an even more interesting story: larger cities are not only generating more revenue, but they’re also growing faster than smaller cities. This widening gap indicates that smaller municipalities will require substantially greater support from central and state governments, through increased transfers, capacity-building initiatives, or targeted urbanization programs – to keep pace with the demands of rapid urban growth. Without such interventions, the revenue disparity between large and small ULGs is likely to deepen over time.  


    Big Cities Under the Lens: Who’s Leading the Way? 

    Now we know that India’s largest cities are at the forefront of the country’s growth trajectory, with their total revenues far exceeding those of smaller urban local governments. But as the graph below illustrates, there is considerable variation in total revenue even within these major cities.  

    While population size plays a critical role – Mumbai, as India’s most populous city, naturally generates substantial revenue, the disparity remains significant even when examined on a per capita basis. This suggests that factors beyond population, such as economic activity, tax collection efficiency, and administrative capacity, drive revenue differences among India’s largest cities. 

    Among the remaining large cities, Chennai reports the lowest total revenue at ₹3,255 crores. However, looking at per capita revenue, Hyderabad registers the weakest performance, with Bengaluru not far ahead. 

    These contrasts underscore the uneven fiscal capacity among major urban centres, shaped by differences in economic activity, administrative efficiency, local revenue mobilization patterns, and crucially, the extent of devolution of functions from state governments to ULGs.

    Ultimately, these figures highlight the importance of examining city finances through multiple lenses; both absolute and comparative metrics are essential to understanding the true fiscal health of India’s urban landscape. 


    Beyond the City: Mapping Revenue across States 

    Indian states vary significantly from each other in terms of level of urbanization, political environment, and institutional capacity. These factors significantly influence how cities generate and mobilize revenue. 

    The state-wise per capita revenue data reveals distinctive regional patterns across India. The most striking is the massive variation that exists across the country, ranging from Assam’s ₹1,525 to Maharashtra’s ₹18,115 – a more than tenfold difference in per capita revenue. Here, Maharashtra stands out dramatically as the highest per capita revenue generator, reflecting Mumbai’s economic dominance.

    Southern states demonstrate consistently strong performance, with Kerala (₹7,481), Karnataka (₹4,745), Tamil Nadu (₹4,191), and Telangana (₹3,741) all showing relatively high per capita revenues.

    Western states also excel, with Gujarat generating ₹5,839 per capita and Madhya Pradesh reaching ₹5,017. In contrast, northeastern states lag significantly behind, with Assam at ₹1,525 and Mizoram at ₹1,467 representing the lowest figures.  

    These disparities underscore that revenue generation capacity depends not just on urbanization levels, but critically on the extent of functional devolution and administrative powers granted to ULGs – more urbanized states don’t necessarily generate more revenue if their local governments lack adequate authority and resources.  


    Conclusion 

    This analysis reveals a stark reality: India’s urban revenue landscape is marked by significant concentration and growing disparities. Larger cities not only command the lion’s share of total revenue but also generate substantially higher per capita income and experience faster growth rates. Addressing this challenge requires recognizing that state-level decisions about revenue-sharing, functional devolution, and administrative autonomy critically shape urban fiscal capacity. We need to investigate these patterns further to understand how they extend beyond population size to economic activity, and administrative capacity.

    These widening gaps raise critical concerns about fiscal federalism and the sustainability of India’s urbanization trajectory. As revenue inequality between large and small cities increase, the challenge ahead involves both learning from high-performing cities and reforming state-level frameworks that govern urban finance. 

    Mumbai has emerged as a clear outlier throughout this analysis. Stay tuned for an analysis, where we dive deeper into what makes India’s financial capital such a revenue powerhouse. 

    Note: To ensure comprehensive representation and account for variations in data coverage and quality across cities, the figures presented are based on extrapolated financial data covering all 4,824 cities. Among these, 2,541 cities (approximately 60%) possess 3 years of contiguous data (2019–20 to 2021–22) in Cityfinance platform. Data from these cities have been systematically extrapolated using the ’per capita scaling methodology’ to reflect the financial performance of the complete set of 4,824 cities. Learn more about the extrapolation methodology here.  


  • How Many Taxes Do Cities Levy?

    How Many Taxes Do Cities Levy?

    India is going through rapid urbanization. By 2036, our cities will be home to 40% of our population, which is approximately 600 million people. How well we manage our urban transformation will play a crucial role in our path to development. Therefore, we need to build necessary infrastructure that will make our cities liveable, resilient and inclusive.

    Every city needs revenue to function and meet the demands of an expanding urban population. Roads need to be built and maintained, water should be available, waste needs to be managed, and public spaces need upkeep. All these cost money. But where does this money come from? 

    Where Do Cities Get Their Money From? 

    For our urban local governments, the revenue to run a city comes from a combination of sources, with revenue from taxes forming a critical foundation of municipal finance. Tax revenue gives urban local governments a steady stream of income and consistent cash flow to pay for necessary services.  

    The urban local governments in India have access to a diverse set of tax instruments. From property tax, water supply and drainage (WSD) tax to entertainment tax, our cities and towns can levy over 14 different types of taxes, each designed to fund specific aspects of urban life or tap into different economic activities within city limits. This gives urban local governments a rich array of options. But is this the reality on the ground?  

    Recent analysis of 3,377 urban local governments in India for the financial year 2021-22, reveal an interesting picture. (See figure 1) 

    Figure 1

    Fig.1 highlights both the dominance of core revenue streams, such as property tax and the underutilization of other tax instruments across urban local governments. With 98% of the urban local governments levying property tax, it is an almost universal source of funding for cities. Water supply and drainage taxes (WSD Tax) are the second most levied tax, levied by about 36% of urban local governments, indicating the significance of utility-based fees in municipal tax revenue portfolios. 

    Beyond these two dominant revenue sources, adoption falls sharply. Advertisement taxes and professional taxes are each levied by only about 23% of the urban local governments. Other tax instruments like sewerage tax, education tax, lighting tax, and conservancy tax see even more limited adoption, with the percentage of urban local governments levying them dropping to under 10%. Specialized taxes such as entertainment tax, vehicle tax, and electricity tax are utilized by fewer than 100 cities each, and levies like pilgrimage tax or taxes on carts are virtually absent from the municipal revenue landscape. 

    Tax Diversification Among Urban Local Governments 

    There are more than 10 different sources of tax revenue that our cities can tap into, but in practice, what is the number of taxes levied by our cities? Let us look at the data from 2021-22.  

    Figure 2

    The chart reveals a lack of tax revenue diversification across urban local governments. Out of the 3,377 ULGs we analysed, that levy taxes, nearly one-quarter (23%) of ULGs levy only a single tax – property tax, which often lacks elasticity. This is primarily because once properties are assessed and valuations remain unchanged, the tax base tends to stagnate, particularly in cities with slow construction activity or infrequent revaluations. Thus, while an important and stable source of revenue, property tax can have an inherent ceiling. 

    Thus, cities that rely solely on property tax risk revenue stagnation, particularly in slower-growing urban areas. A wider tax portfolio can help cities stabilize income across economic cycles, reduce overdependence on a single source, and build stronger fiscal resilience. 

    The largest proportion of ULGs (31%) levy two taxes, indicating a slightly broader but still limited tax base. Progressively fewer ULGs levy three taxes (25%) or four taxes (11%), while only 10% of ULGs have achieved broader diversification by levying five or more taxes. 

    Unlocking Cities’ Fiscal Potential 

    The variation across Indian cities reflects a complex interplay of structural, administrative, and political factors. 

    Many urban local governments (ULGs) lack the technological systems, trained personnel and digital infrastructure needed to administer a diverse set of taxes especially in smaller cities. But capacity alone doesn’t explain the full picture. 

    State-level regulations and frameworks also shape what cities can legally levy, and these frameworks vary widely. Despite the 74th Constitutional Amendment Act mandating the devolution of functions to ULBs, many core urban services such as water supply, sanitation remain under the control of state-run parastatals. This limits the fiscal autonomy of cities and diminishes their ability to levy service-linked taxes.  

    Local enforcement capabilities, political considerations and taxpayer resistance also contribute to the patterns we observe. A city may have the legal authority to levy a particular tax but lack enforcement at the local level, or it may face administrative challenges in levying taxes from informal sectors. Together, these factors point to the truth that many Indian cities have significant untapped potential that remains locked behind barriers of capacity, mandate, and implementation. 

    Expanding the tax mix is not simply a matter of passing new bylaws or issuing notifications. It requires building systems for property and business assessment that can accurately identify tax bases and calculate liabilities. As mentioned in the property tax toolkit, cities need efficient valuation, assessment and billing mechanisms that can reach taxpayers reliably and modern payment systems that make compliance convenient. Effective collection processes, including follow-up on delinquencies and enforcement mechanisms, are essential to ensure that levied taxes generate revenue. Beyond infrastructure and systems, cities need comprehensive capacity-building initiatives that provide technical support, facilitate peer learning, share best practices from successful urban local governments, and help cities overcome specific implementation challenges they face.  

    Looking into the tax revenue data of Indian cities reveals some intriguing patterns that need deeper investigation: Why do only 36% of cities levy water supply and drainage taxes when water infrastructure is a universal urban need? How do these patterns in tax revenue change from state to state? Which cities levy 5 or more types of taxes? What are they doing differently from other cities? How will the composition look for cities across different population categories or city types? These are some interesting questions to think about.

    These patterns in municipal tax data offer more than just numbers; they hint at deeper questions about how cities govern, what they prioritize and where reform might begin.  

    To explore the data further, dive deeper into city-level insights, or see where your city stands head to our homepage and start exploring.  

    Image credit: Photo by Amit Chivilkar on Unsplash