
India is going through rapid urbanization. By 2036, our cities will be home to 40% of our population, which is approximately 600 million people. How well we manage our urban transformation will play a crucial role in our path to development. Therefore, we need to build necessary infrastructure that will make our cities liveable, resilient and inclusive.
Every city needs revenue to function and meet the demands of an expanding urban population. Roads need to be built and maintained, water should be available, waste needs to be managed, and public spaces need upkeep. All these cost money. But where does this money come from?
Where Do Cities Get Their Money From?
For our urban local governments, the revenue to run a city comes from a combination of sources, with revenue from taxes forming a critical foundation of municipal finance. Tax revenue gives urban local governments a steady stream of income and consistent cash flow to pay for necessary services.
The urban local governments in India have access to a diverse set of tax instruments. From property tax, water supply and drainage (WSD) tax to entertainment tax, our cities and towns can levy over 14 different types of taxes, each designed to fund specific aspects of urban life or tap into different economic activities within city limits. This gives urban local governments a rich array of options. But is this the reality on the ground?
Recent analysis of 3,377 urban local governments in India for the financial year 2021-22, reveal an interesting picture. (See figure 1)
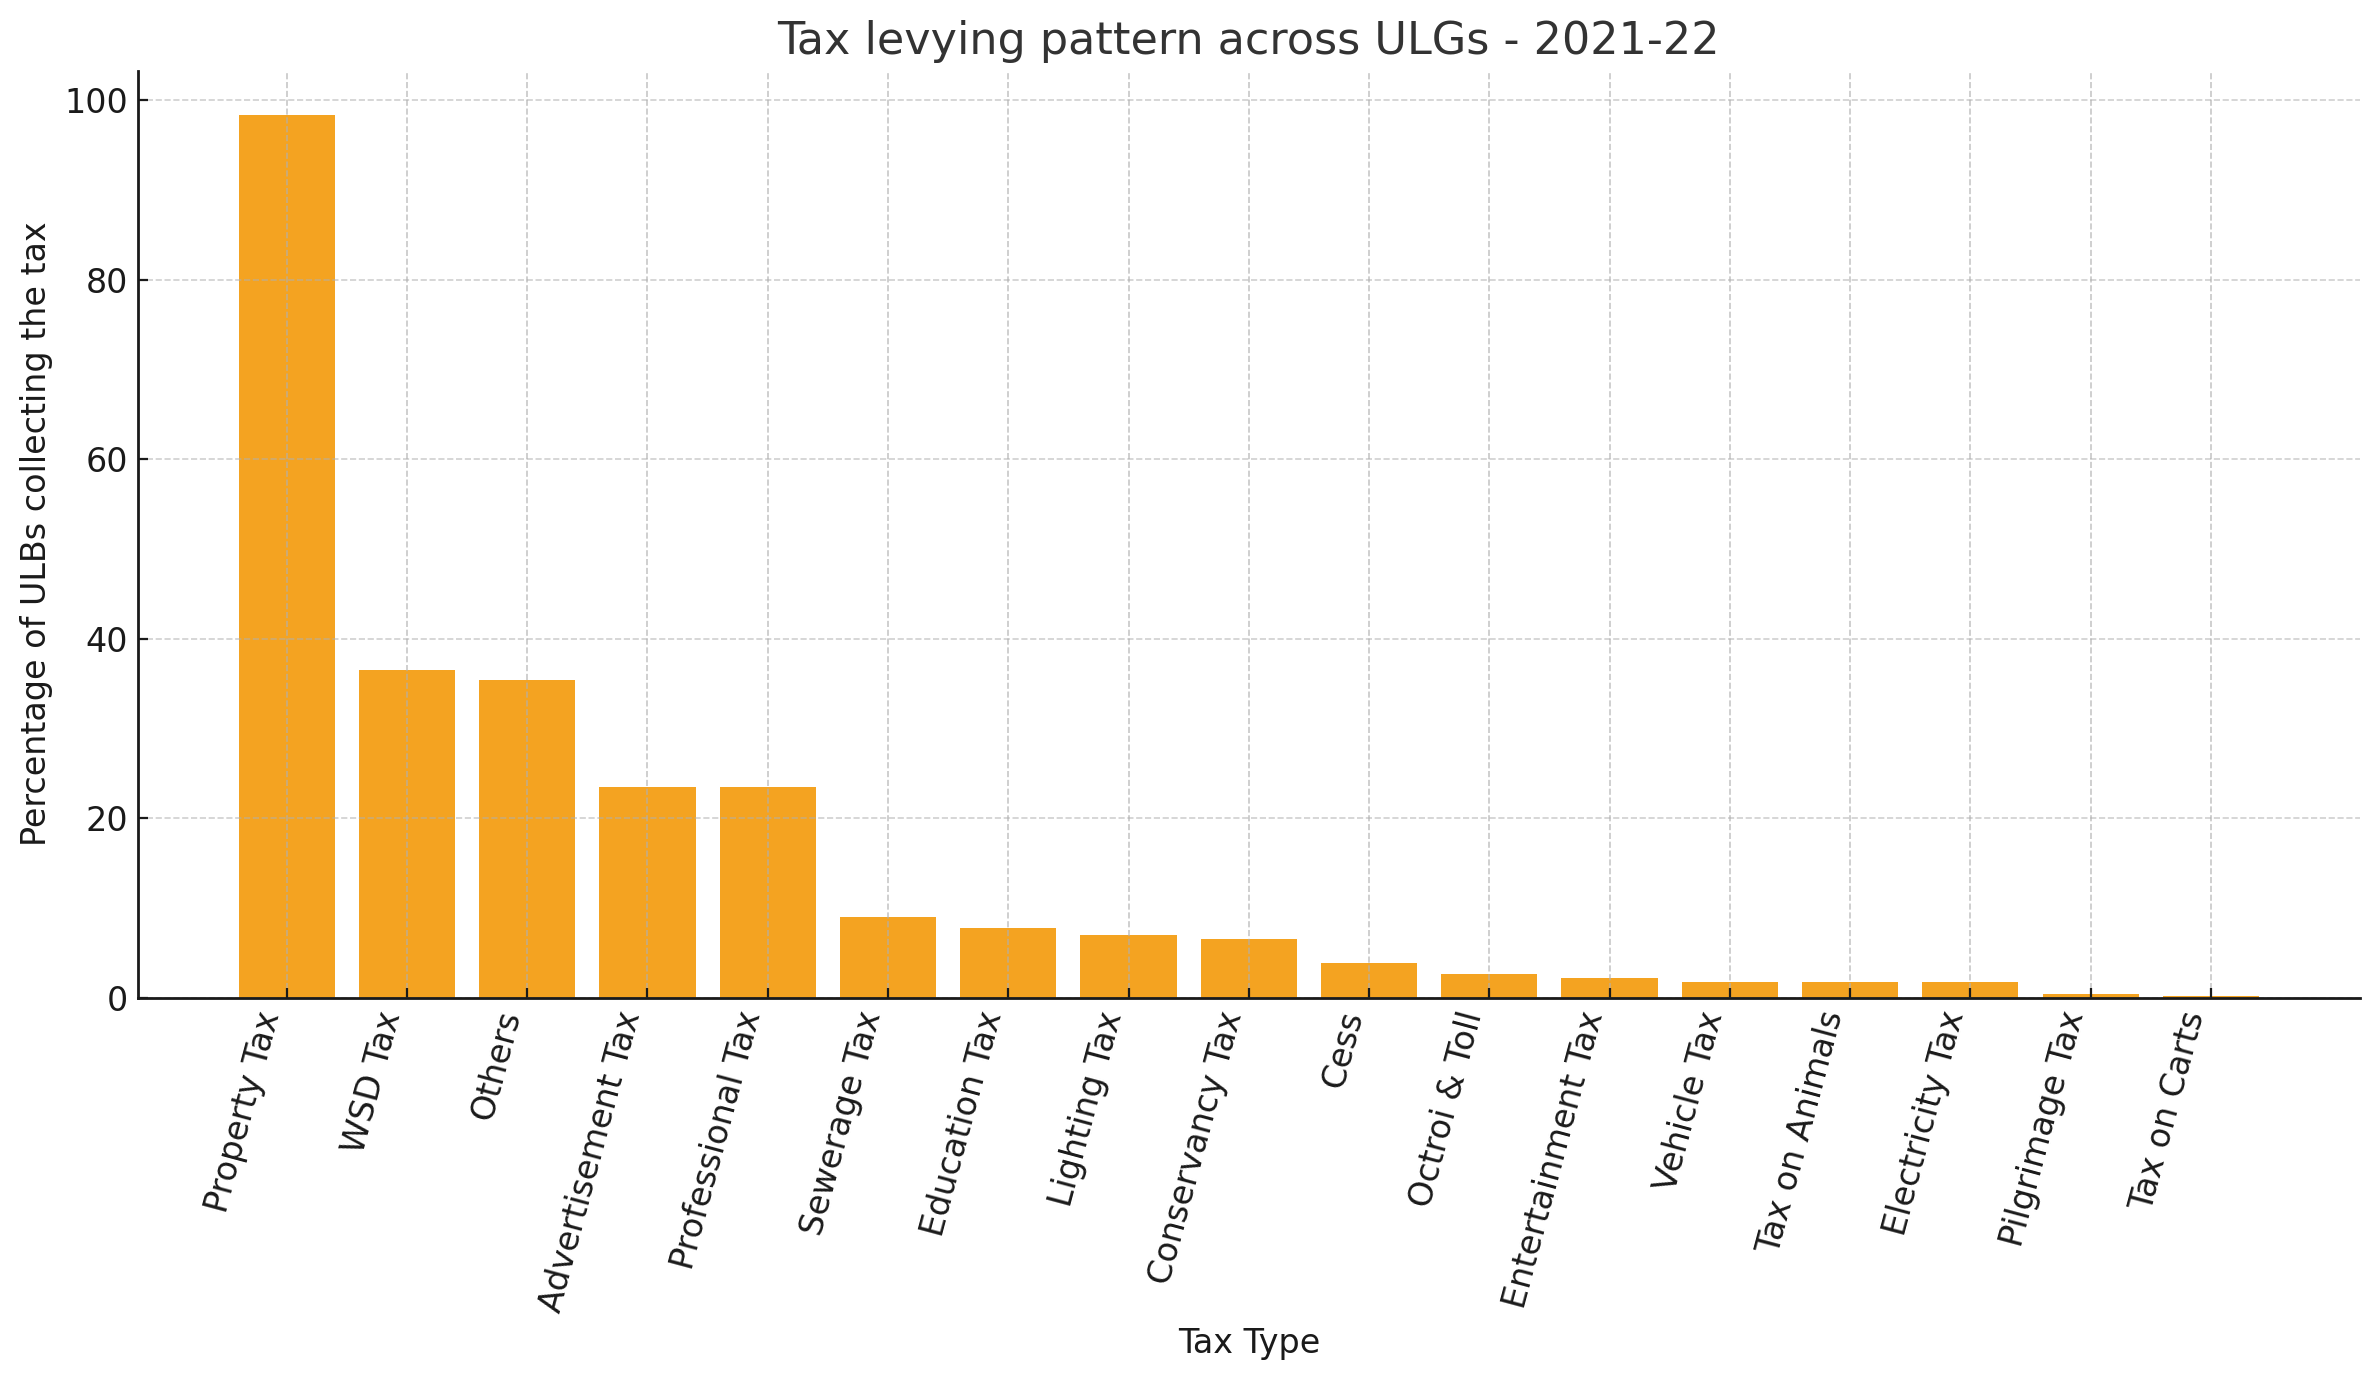
Fig.1 highlights both the dominance of core revenue streams, such as property tax and the underutilization of other tax instruments across urban local governments. With 98% of the urban local governments levying property tax, it is an almost universal source of funding for cities. Water supply and drainage taxes (WSD Tax) are the second most levied tax, levied by about 36% of urban local governments, indicating the significance of utility-based fees in municipal tax revenue portfolios.
Beyond these two dominant revenue sources, adoption falls sharply. Advertisement taxes and professional taxes are each levied by only about 23% of the urban local governments. Other tax instruments like sewerage tax, education tax, lighting tax, and conservancy tax see even more limited adoption, with the percentage of urban local governments levying them dropping to under 10%. Specialized taxes such as entertainment tax, vehicle tax, and electricity tax are utilized by fewer than 100 cities each, and levies like pilgrimage tax or taxes on carts are virtually absent from the municipal revenue landscape.
Tax Diversification Among Urban Local Governments
There are more than 10 different sources of tax revenue that our cities can tap into, but in practice, what is the number of taxes levied by our cities? Let us look at the data from 2021-22.
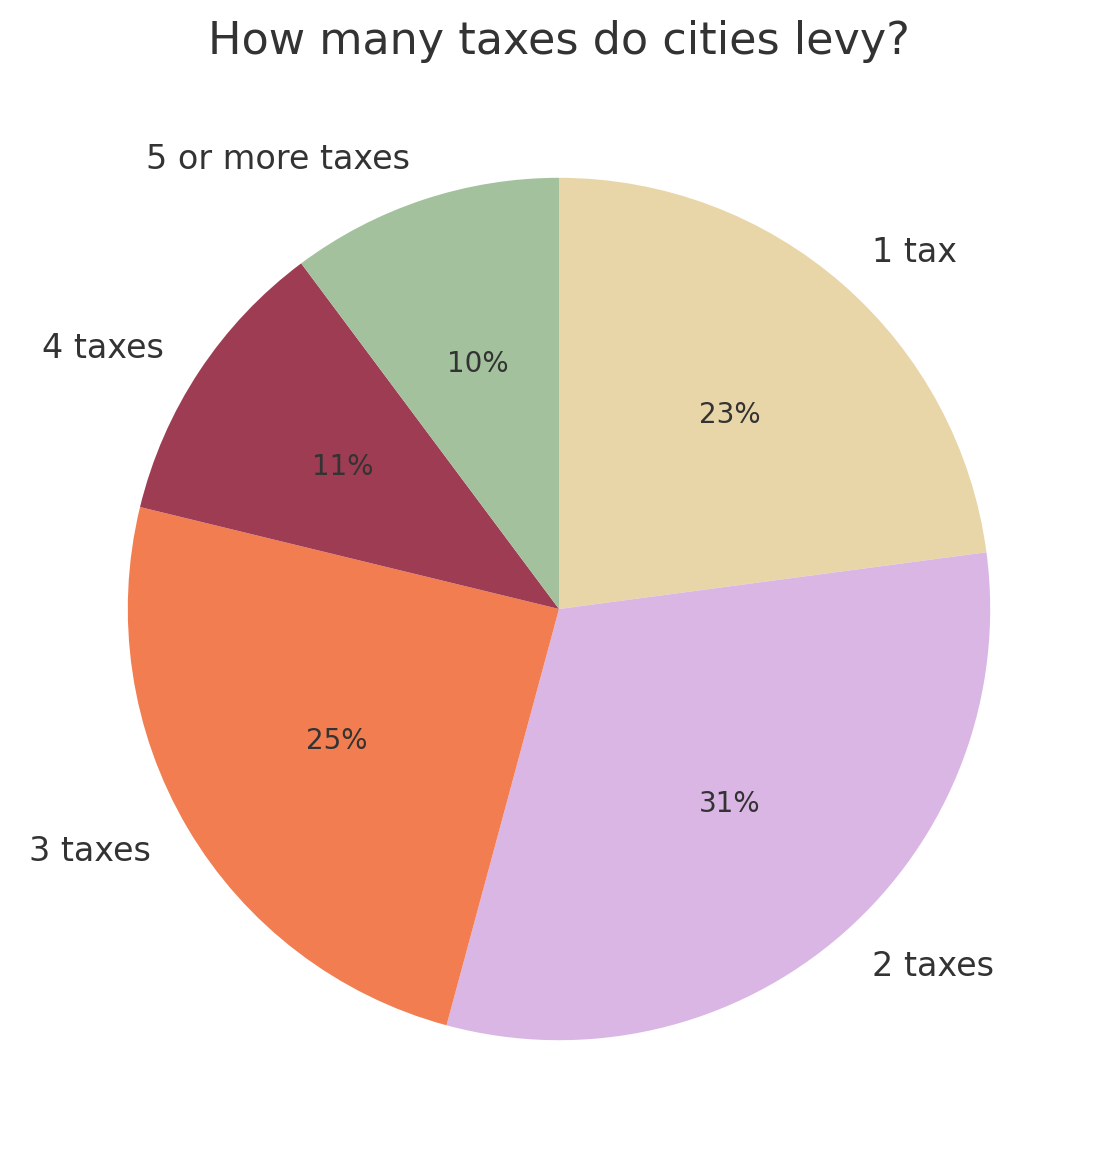
The chart reveals a lack of tax revenue diversification across urban local governments. Out of the 3,377 ULGs we analysed, that levy taxes, nearly one-quarter (23%) of ULGs levy only a single tax – property tax, which often lacks elasticity. This is primarily because once properties are assessed and valuations remain unchanged, the tax base tends to stagnate, particularly in cities with slow construction activity or infrequent revaluations. Thus, while an important and stable source of revenue, property tax can have an inherent ceiling.
Thus, cities that rely solely on property tax risk revenue stagnation, particularly in slower-growing urban areas. A wider tax portfolio can help cities stabilize income across economic cycles, reduce overdependence on a single source, and build stronger fiscal resilience.
The largest proportion of ULGs (31%) levy two taxes, indicating a slightly broader but still limited tax base. Progressively fewer ULGs levy three taxes (25%) or four taxes (11%), while only 10% of ULGs have achieved broader diversification by levying five or more taxes.
Unlocking Cities’ Fiscal Potential
The variation across Indian cities reflects a complex interplay of structural, administrative, and political factors.
Many urban local governments (ULGs) lack the technological systems, trained personnel and digital infrastructure needed to administer a diverse set of taxes especially in smaller cities. But capacity alone doesn’t explain the full picture.
State-level regulations and frameworks also shape what cities can legally levy, and these frameworks vary widely. Despite the 74th Constitutional Amendment Act mandating the devolution of functions to ULBs, many core urban services such as water supply, sanitation remain under the control of state-run parastatals. This limits the fiscal autonomy of cities and diminishes their ability to levy service-linked taxes.
Local enforcement capabilities, political considerations and taxpayer resistance also contribute to the patterns we observe. A city may have the legal authority to levy a particular tax but lack enforcement at the local level, or it may face administrative challenges in levying taxes from informal sectors. Together, these factors point to the truth that many Indian cities have significant untapped potential that remains locked behind barriers of capacity, mandate, and implementation.
Expanding the tax mix is not simply a matter of passing new bylaws or issuing notifications. It requires building systems for property and business assessment that can accurately identify tax bases and calculate liabilities. As mentioned in the property tax toolkit, cities need efficient valuation, assessment and billing mechanisms that can reach taxpayers reliably and modern payment systems that make compliance convenient. Effective collection processes, including follow-up on delinquencies and enforcement mechanisms, are essential to ensure that levied taxes generate revenue. Beyond infrastructure and systems, cities need comprehensive capacity-building initiatives that provide technical support, facilitate peer learning, share best practices from successful urban local governments, and help cities overcome specific implementation challenges they face.
Looking into the tax revenue data of Indian cities reveals some intriguing patterns that need deeper investigation: Why do only 36% of cities levy water supply and drainage taxes when water infrastructure is a universal urban need? How do these patterns in tax revenue change from state to state? Which cities levy 5 or more types of taxes? What are they doing differently from other cities? How will the composition look for cities across different population categories or city types? These are some interesting questions to think about.
These patterns in municipal tax data offer more than just numbers; they hint at deeper questions about how cities govern, what they prioritize and where reform might begin.
To explore the data further, dive deeper into city-level insights, or see where your city stands head to our homepage and start exploring.
—
Image credit: Photo by Amit Chivilkar on Unsplash