In our previous blog on total revenue of Indian cities, we explored how total revenues vary dramatically across Indian cities, with resources concentrated in major metropolitan areas. But these total revenue figures reveal only a part of the story.
Understanding where that revenue comes from is equally important. The composition of a city’s revenue, how much it raises on its own versus how much it receives from higher tiers of government, speaks directly to its fiscal autonomy, financial resilience, and capacity for self-determined growth. Examining revenue composition thus moves the conversation beyond how much cities earn to how they earn it.
As shown in the figure above, at the national level, the composition of municipal revenues exhibits a substantial share of grant revenue across ULGs. However, when we look at the graph below, we can see that this share is comparatively lower for million-plus cities. CityFinance data shows that larger ULGs, particularly million-plus cities, demonstrate a stronger own-source revenue base, supported by both tax and non-tax revenues, relative to smaller cities.
Although million-plus cities receive significant volumes of grants, these constitute a smaller proportion of their total revenue when compared to smaller ULGs. This reflects the larger revenue base of metropolitan cities, where tax and non-tax revenues contribute a greater share to overall municipal finances.
Notably, 4M+ cities show a relatively higher share of non-tax revenue within their revenue. This indicates a more diversified revenue composition with contributions from user charges, fees, rentals, and other service-related income streams alongside tax revenue. In contrast, smaller ULGs exhibit a relatively higher dependence on revenue grants within their overall revenue structure.
Overall, the data highlights variation in revenue composition across city size categories, reflecting differences in revenue structure and scale across urban India.
When compared with the national profile, state-wise regional variation becomes much more evident for FY 2021-22.
Northern states such as Uttar Pradesh (80% grants), Uttarakhand (84%), and Bihar (67%) show grant shares well above the national aggregate composition, with relatively lower tax and non-tax contributions. In contrast, southern states display a different composition: Telangana records 48% tax revenue and Andhra Pradesh 42% tax revenue, while Tamil Nadu shows a more balanced mix with 29% tax revenue and 34% grants. Gujrat and Maharashtra also exhibit less dependence on grants when compared to national aggregate composition.
Overall, the comparison reflects regional differences in revenue structure relative to the national composition, highlighting variation across India’s urban fiscal landscape.
The Way Forward
The analysis underscores that revenue profile of cities in India cannot be understood through aggregate revenue figures alone. A deeper look at revenue composition reveals important distinctions. While the proportion of intergovernmental grants in revenue composition of smaller cities remains higher, larger cities continue to receive higher per capita grants. The findings suggest that million-plus cities show higher collection of own-source revenue. Assigned revenue on the other hand decreased consistently which is a trend that warrants closer examination. The variations across states further reinforce that fiscal outcomes are influenced by governance structures, devolution frameworks and accounting practices.
Moving beyond aggregate figures to examine how city revenues are composed will offer a far more comprehensive understanding of where Indian cities stand fiscally and what it will take to strengthen their financial foundations.
In our next blog, we turn to Own Source Revenue performance across city categories and states and what it reveals about the fiscal health of India’s urban local governments. Stay tuned.
Note: All data is sourced from the Annual Financial Statements submitted by the ULGs on the CityFinance platform. To ensure comprehensive representation and account for variations in data coverage and quality across cities, the figures presented are based on extrapolated financial data covering all 4,824 cities. Among these, 2,541 cities (approximately 60%) possess 3 years of contiguous data (2019–20 to 2021–22) in Cityfinance platform. Data from these cities have been systematically extrapolated using the ’per capita scaling methodology’ to reflect the financial performance of the complete set of 4,824 cities. Learn more about the extrapolation methodology here.
This Total Expenditure Primer marks the second edition in a multi-part series on the city financial data hosted on CityFinance.in. Each edition in the series will spotlight one key fiscal indicator, offering a focused analysis to demonstrate the different kinds of insights that can be drawn from the data and how they inform a deeper understanding of urban finance. This initiative aims to foster greater understanding and engagement with the financial data of Indian cities, with the broader goal of enabling deeper analysis and further research in this critical area. Here we will be dealing with a crucial parameter that determines a city’s financial stability: Total Expenditure.
What is a City’s Total Expenditure?
Urban infrastructure and services, from street lighting and water supply to road maintenance, are tangible results of a city’s expenditure at work. Understanding how much cities spend, how these funds are allocated, and why significant variations exist across urban centres is essential to evaluating the state of India’s urban governance.
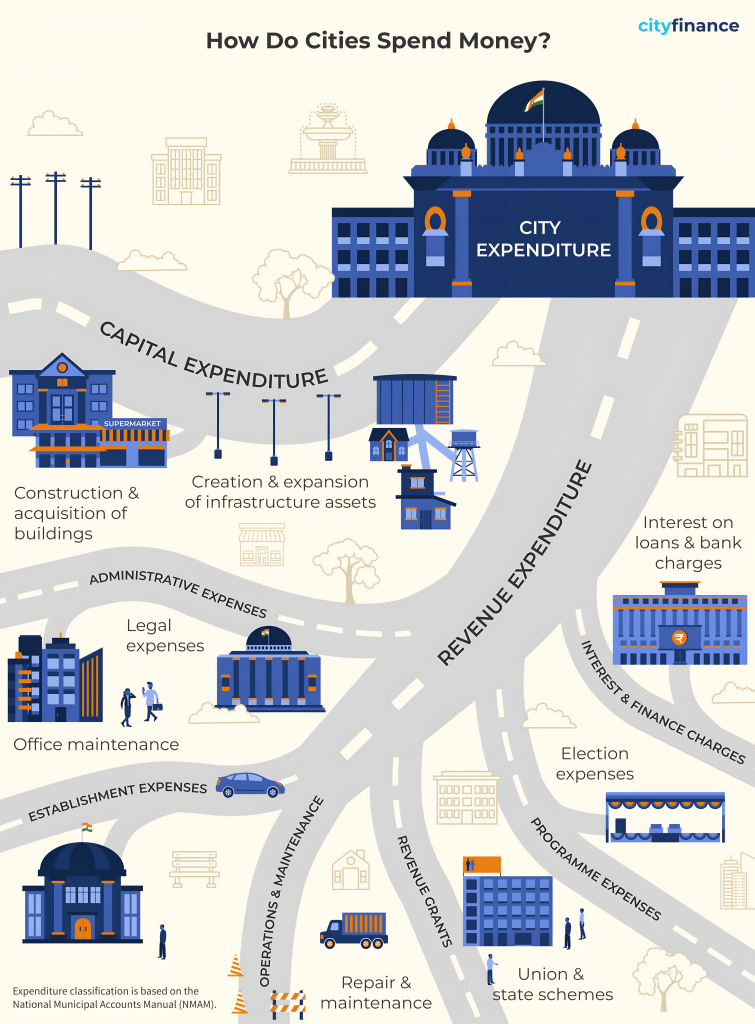
At its simplest, Total Expenditure represents the complete amount of money spent by an Urban Local Government (ULG) during a financial year. It comprises two main components:
Revenue Expenditure covers the day-to-day operational costs necessary to keep urban services running smoothly.
Capital Expenditure refers to investments in creating or upgrading long-term infrastructure and assets.
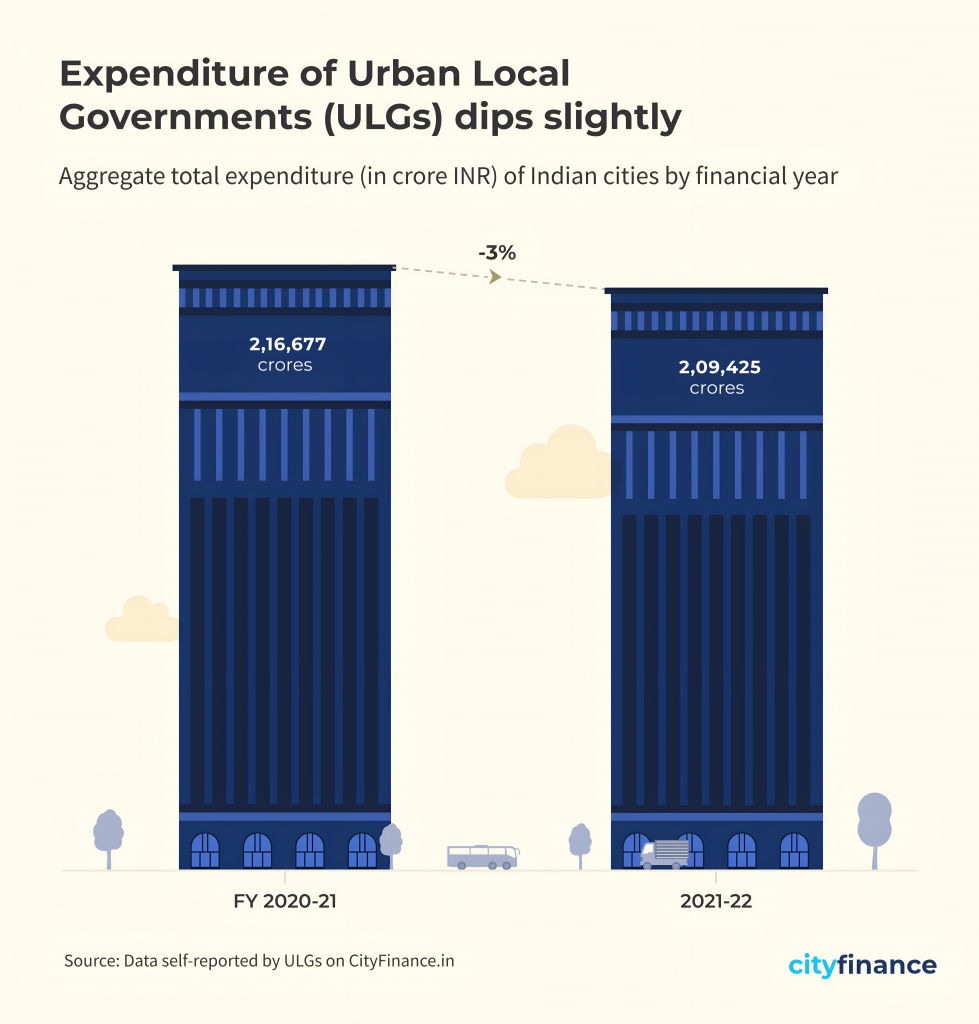
ULG Expenditure Trends: A Decline in Spending (2020-2022)
Data shows that total expenditure of ULGs declined from 2020-21 to 2021-22. This drop in expenditure requires detailed investigation to determine whether it stems from reduced developmental or capital spending, lower recovery-related expenditure post-pandemic, contraction in government programmes, or a combination of these factors.
To understand this expenditure trend, let us examine how this change is reflected in different population categories.
The Expenditure Divide: Unequal Fiscal Capacity across Cities
Looking at the chart, it is clear that expenditure patterns vary significantly across different city categories. While it is expected that larger cities would spend more, the disparity is stark. Large cities with populations above 4 million account for the lion’s share of urban spending while smaller cities demonstrate modest expenditure levels.
It is important to note that these cities differ significantly in population size, revenue composition, urban service priorities, and other characteristics. Therefore, analysing expenditure patterns requires a differentiated approach that accounts for the distinct contexts of different city categories.
Examining per-capita spending reveals an interesting picture with megacities spending several times more per urban resident than mid-sized and smaller ULGs. This divergent fiscal behaviour suggests structural inequalities in urban finance. We must ask whether these differences stem from variations in resource availability, administrative capacity, or the differentiated cost of delivery of services in a metropolis versus a small town.
Across India: The Geography of Urban Spending
Expenditure capacity also varies by geography. As seen above, when we look at a state-by-state comparison, Southern and Western states demonstrate strong fiscal performance. Northern states show mixed performance, with some states maintaining surpluses while others exhibit low levels of expenditure. North-eastern states reveal an interesting picture with varied fiscal capacities across the region.
From Spending to Service Delivery: The Way Forward
While India’s megacities lead in urban spending, we cannot yet determine whether higher spending translates into better urban outcomes, as we lack the data linkages to connect expenditure with service delivery outcomes.
What matters is allocation. The allocation patterns between revenue and capital expenditure require further study to understand if cities that channel more funds towards water supply, sanitation, mobility, and public spaces, achieve better service quality compared to cities whose spending is dominated by administrative costs. It is important to note that establishment expenses could also reflect investments in hiring personnel to improve urban service delivery, which may contribute positively to service outcomes. However, strengthening local capacity for planning, budgeting, and monitoring is essential to ensure that every additional rupee spent enhances liveability and equity for urban residents.
As India prepares for 600 million urban residents by 2036, understanding these expenditure gaps is critical. As we saw in our previous blog on a city’s total revenue, it is clear that a city’s income streams directly dictate its capacity to spend. Hence, it is important to look at the different revenue streams of a ULG.
Stay tuned for a deep dive into a city’s own revenue. To explore more and see your city’s expenditure in detail, head over to cityfinance.in.
Note: All data is sourced from the Annual Financial Statements submitted by the ULGs on the CityFinance platform. To ensure comprehensive representation and account for variations in data coverage and quality across cities, the figures presented are based on extrapolated financial data covering all 4,824 cities. Among these, 2,541 cities (approximately 60%) possess 3 years of contiguous data (2019–20 to 2021–22) in Cityfinance platform. Data from these cities have been systematically extrapolated using the ’per capita scaling methodology’ to reflect the financial performance of the complete set of 4,824 cities. Learn more about the extrapolation methodology here.
This post comes from the team behind the City Finance platform. We spend our days digging into city financial data to bring you insights like this one.
This Total Revenue Primer marks the first edition in a multi-part series on the financial data of cities hosted on CityFinance.in. Each edition in the series will spotlight one key fiscal indicator, offering a focused analysis to demonstrate the different kinds of insights that can be drawn from the data and how they inform a deeper understanding of urban finance. This initiative aims to foster greater understanding and engagement with financial data of Indian cities, enabling deeper analysis and research in this critical area.
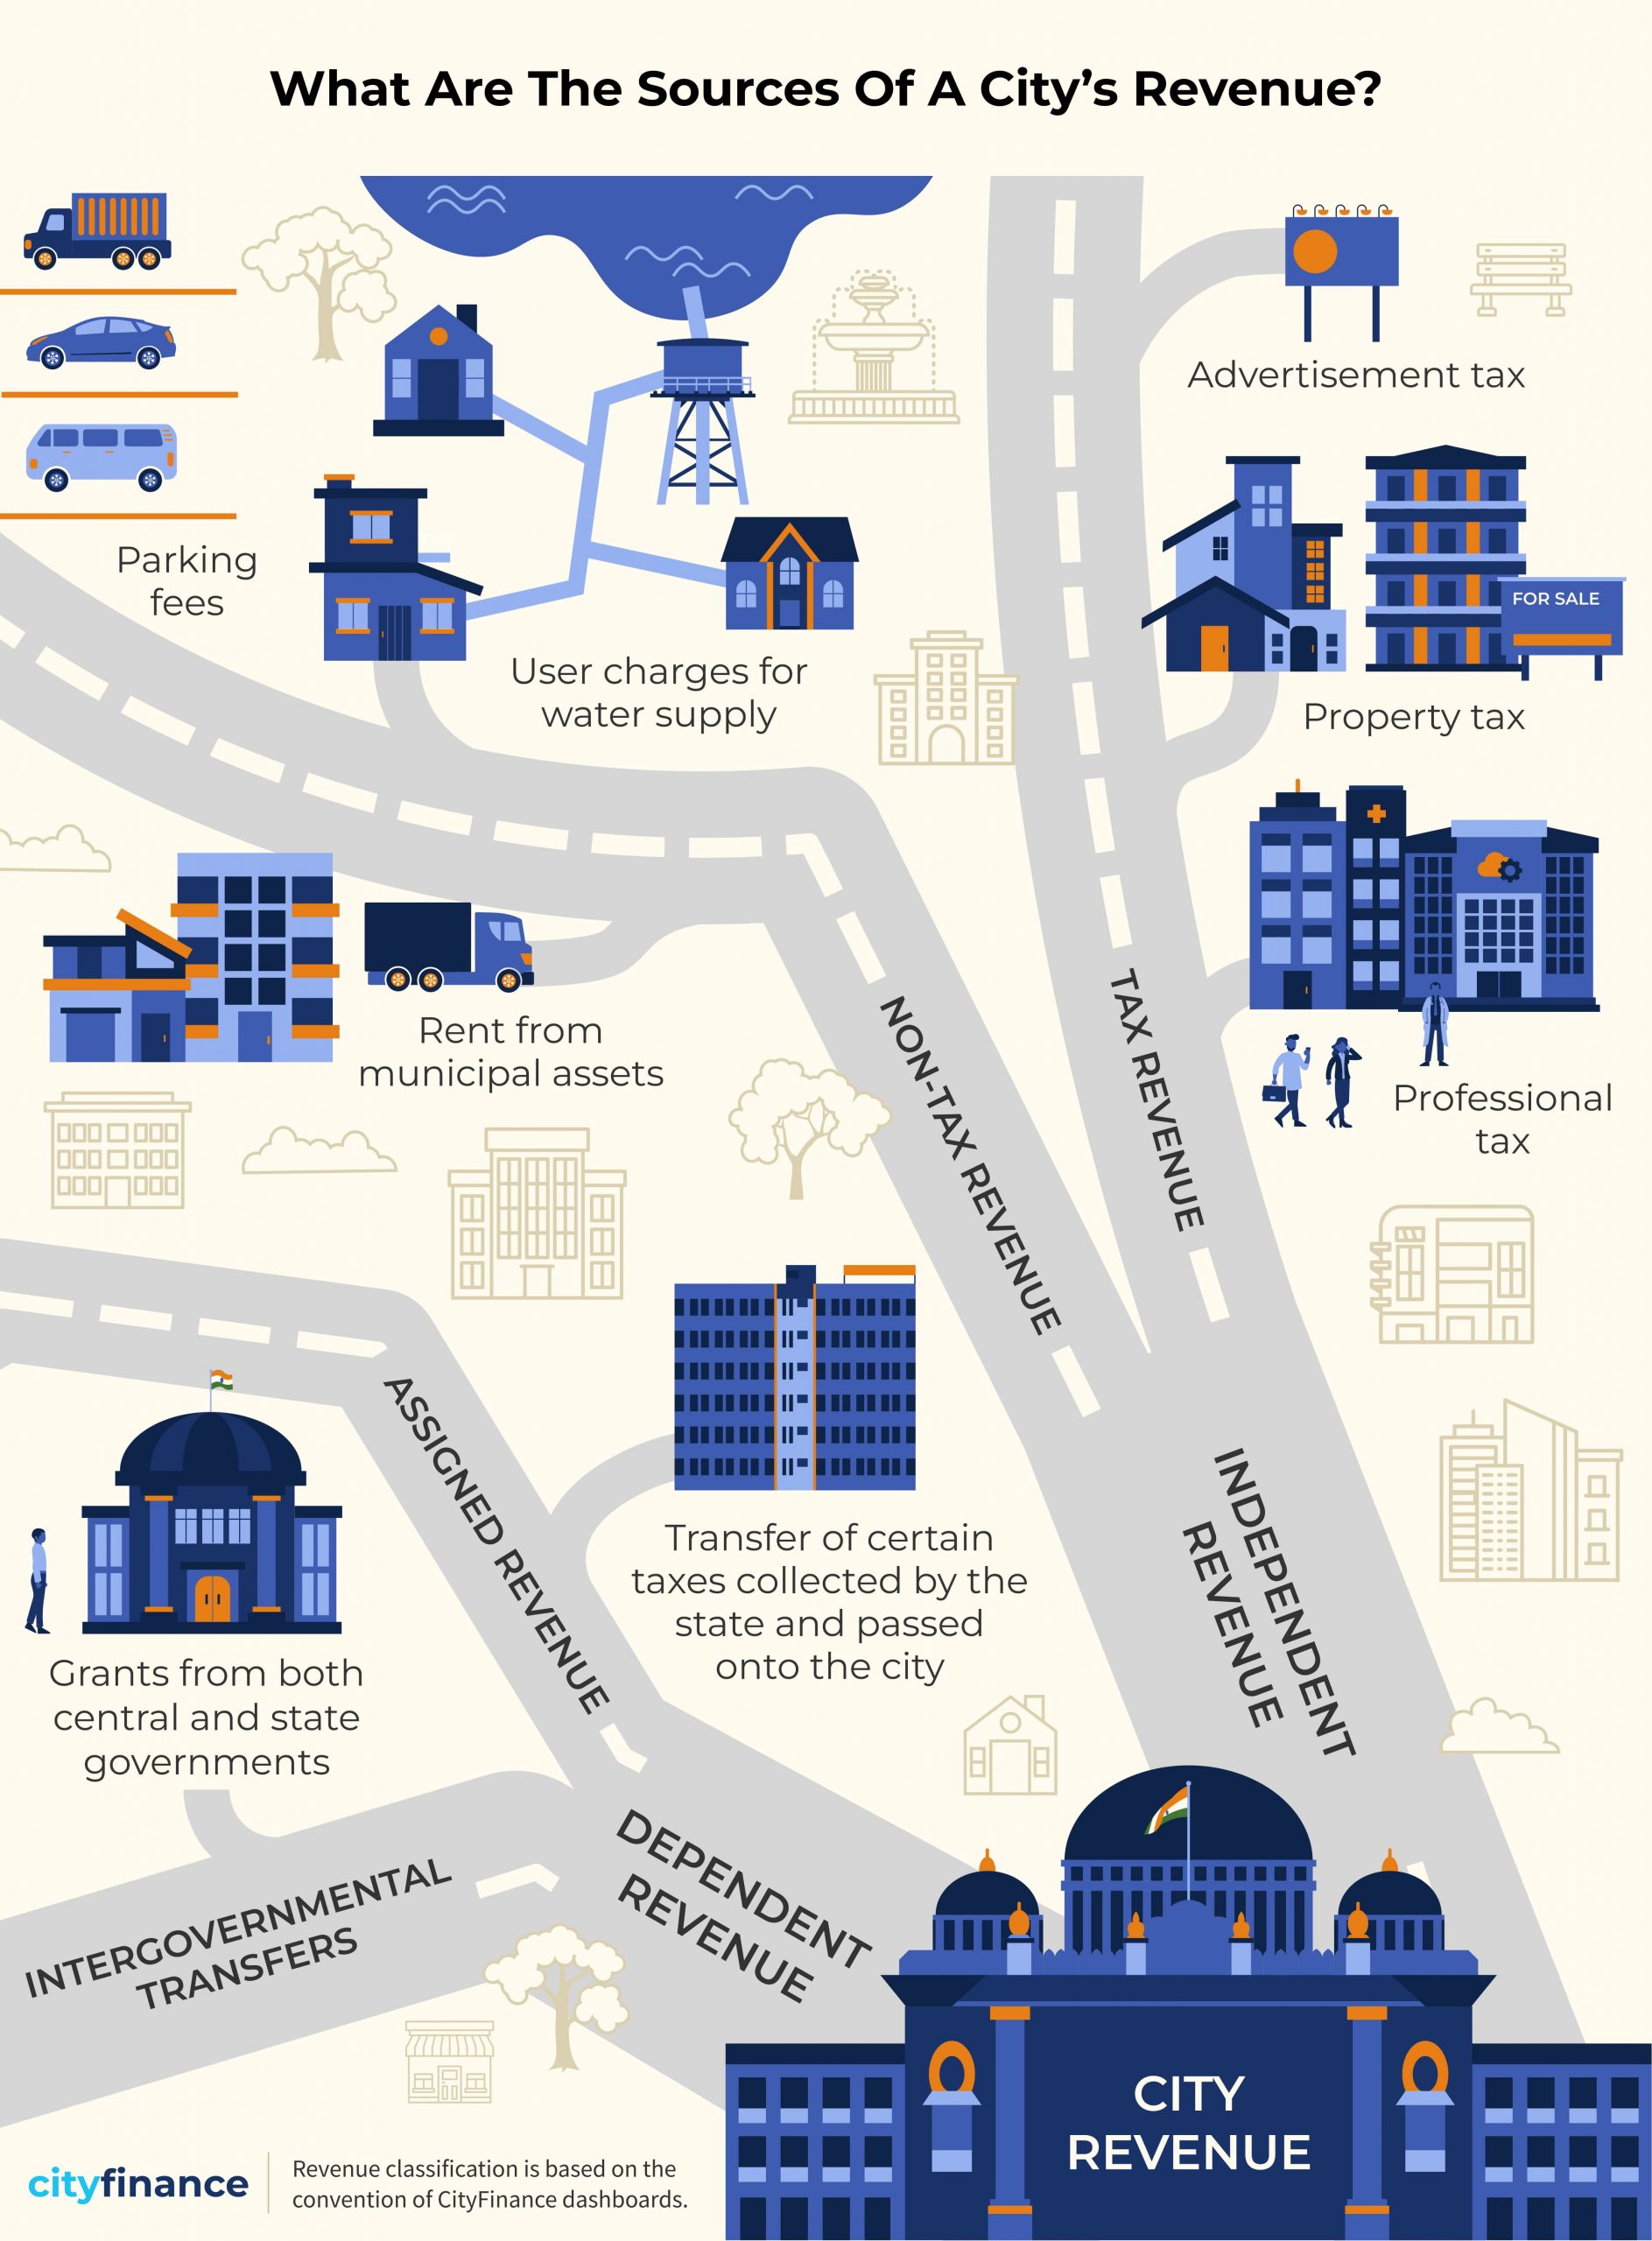
Total revenue refers to the aggregate income a city receives from all sources. Major sources of a city’s revenue include tax revenue, non-tax revenue, assigned revenues, and intergovernmental grants from both state and central governments.
Together, these streams form the financial backbone that supports a city’s operations and development initiatives.
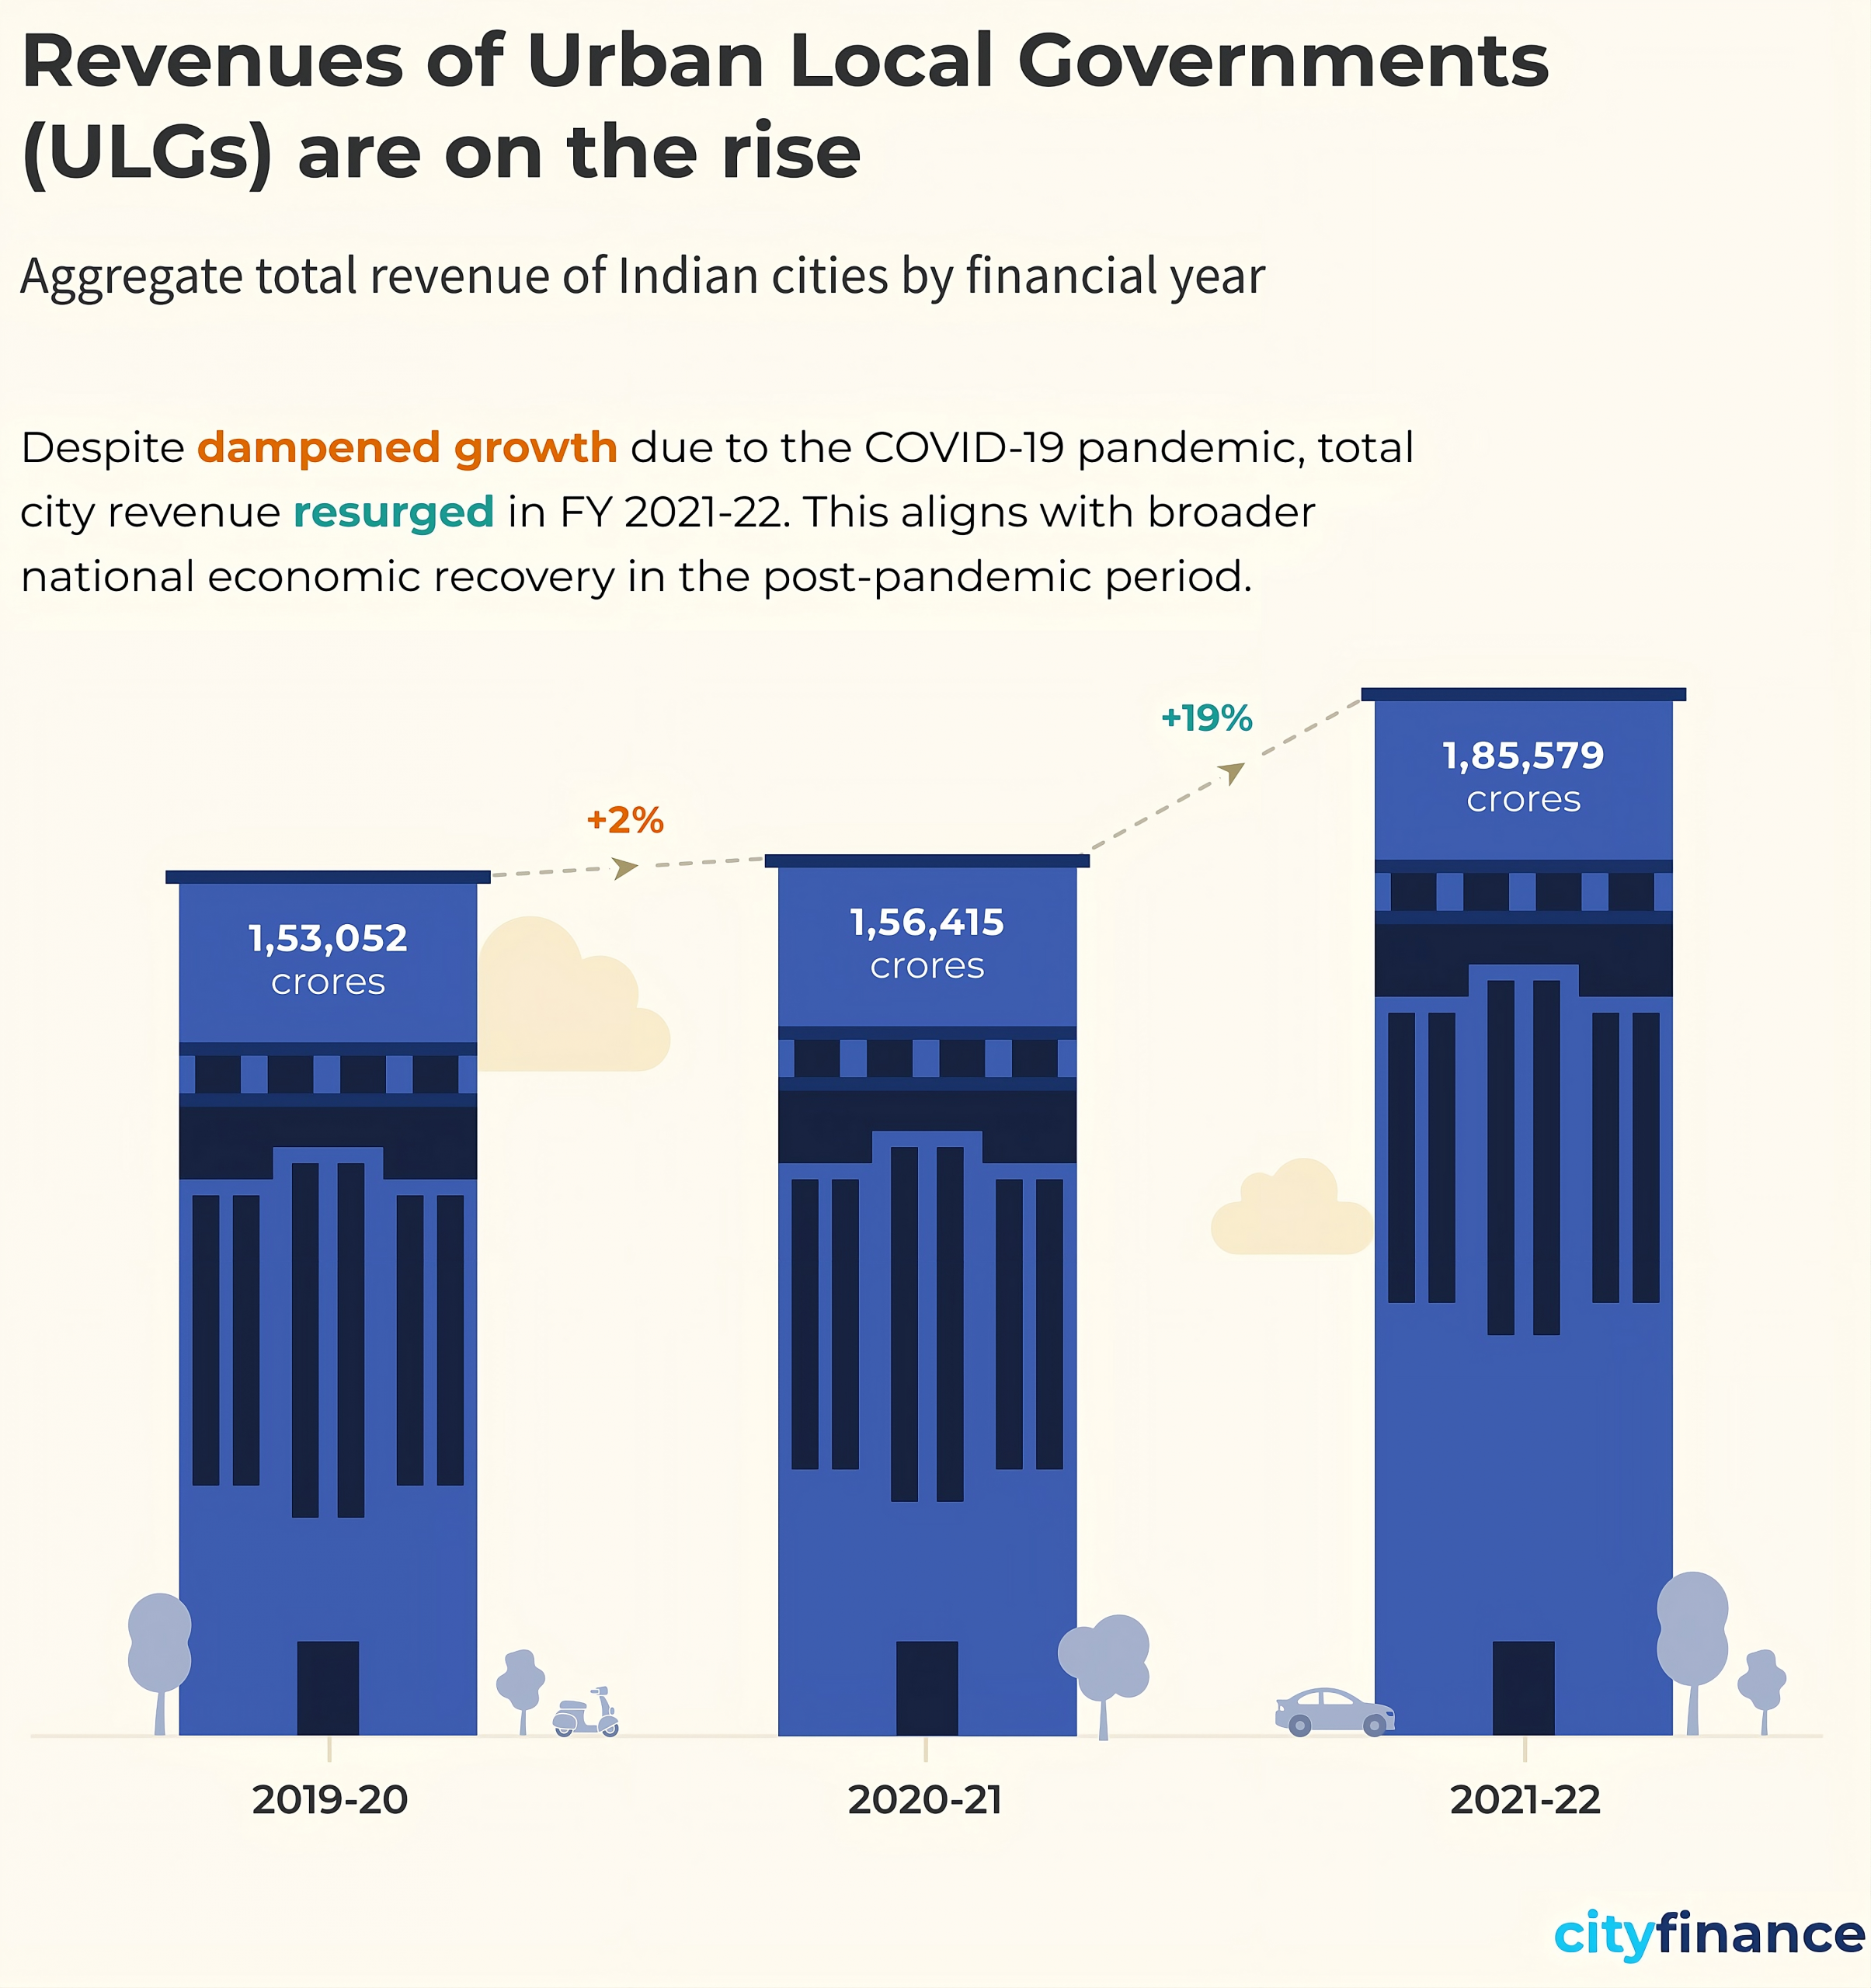
Rising Revenues, Widening Revenue Gaps
Revenues of Urban Local Governments (ULGs) are rising across India, reflecting positive economic growth. However, this increase is far from uniform, with significant disparities emerging between cities.
As we see in the chart above, the 7 cities that serve 17% of the urban population of India report the largest share of receipts at 42%. In comparison, 3,374 cities that serve 41% of India’s urban residents form just 16% of total revenue. Could bigger cities simply have higher revenue because of their larger population base, or does the trend hold even when we look at per capita revenue? Let us examine.
Larger cities generate significantly more revenue per person, with cities in the 4 million plus population category collecting ₹15,542 per capita – nearly twice the next population category. This indicates that the revenue advantage of larger cities is not simply due to their larger population base but reflects genuinely higher per capita economic activity and tax collection capacity.
Growth rates (2020-21 to 2021-22) tell an even more interesting story: larger cities are not only generating more revenue, but they’re also growing faster than smaller cities. This widening gap indicates that smaller municipalities will require substantially greater support from central and state governments, through increased transfers, capacity-building initiatives, or targeted urbanization programs – to keep pace with the demands of rapid urban growth. Without such interventions, the revenue disparity between large and small ULGs is likely to deepen over time.
Big Cities Under the Lens: Who’s Leading the Way?
Now we know that India’s largest cities are at the forefront of the country’s growth trajectory, with their total revenues far exceeding those of smaller urban local governments. But as the graph below illustrates, there is considerable variation in total revenue even within these major cities.
While population size plays a critical role – Mumbai, as India’s most populous city, naturally generates substantial revenue, the disparity remains significant even when examined on a per capita basis. This suggests that factors beyond population, such as economic activity, tax collection efficiency, and administrative capacity, drive revenue differences among India’s largest cities.
Among the remaining large cities, Chennai reports the lowest total revenue at ₹3,255 crores. However, looking at per capita revenue, Hyderabad registers the weakest performance, with Bengaluru not far ahead.
These contrasts underscore the uneven fiscal capacity among major urban centres, shaped by differences in economic activity, administrative efficiency, local revenue mobilization patterns, and crucially, the extent of devolution of functions from state governments to ULGs.
Ultimately, these figures highlight the importance of examining city finances through multiple lenses; both absolute and comparative metrics are essential to understanding the true fiscal health of India’s urban landscape.
Beyond the City: Mapping Revenue across States
Indian states vary significantly from each other in terms of level of urbanization, political environment, and institutional capacity. These factors significantly influence how cities generate and mobilize revenue.
The state-wise per capita revenue data reveals distinctive regional patterns across India. The most striking is the massive variation that exists across the country, ranging from Assam’s ₹1,525 to Maharashtra’s ₹18,115 – a more than tenfold difference in per capita revenue. Here, Maharashtra stands out dramatically as the highest per capita revenue generator, reflecting Mumbai’s economic dominance.
Southern states demonstrate consistently strong performance, with Kerala (₹7,481), Karnataka (₹4,745), Tamil Nadu (₹4,191), and Telangana (₹3,741) all showing relatively high per capita revenues.
Western states also excel, with Gujarat generating ₹5,839 per capita and Madhya Pradesh reaching ₹5,017. In contrast, northeastern states lag significantly behind, with Assam at ₹1,525 and Mizoram at ₹1,467 representing the lowest figures.
These disparities underscore that revenue generation capacity depends not just on urbanization levels, but critically on the extent of functional devolution and administrative powers granted to ULGs – more urbanized states don’t necessarily generate more revenue if their local governments lack adequate authority and resources.
Conclusion
This analysis reveals a stark reality: India’s urban revenue landscape is marked by significant concentration and growing disparities. Larger cities not only command the lion’s share of total revenue but also generate substantially higher per capita income and experience faster growth rates. Addressing this challenge requires recognizing that state-level decisions about revenue-sharing, functional devolution, and administrative autonomy critically shape urban fiscal capacity. We need to investigate these patterns further to understand how they extend beyond population size to economic activity, and administrative capacity.
These widening gaps raise critical concerns about fiscal federalism and the sustainability of India’s urbanization trajectory. As revenue inequality between large and small cities increase, the challenge ahead involves both learning from high-performing cities and reforming state-level frameworks that govern urban finance.
Mumbai has emerged as a clear outlier throughout this analysis. Stay tuned for an analysis, where we dive deeper into what makes India’s financial capital such a revenue powerhouse.
Note: To ensure comprehensive representation and account for variations in data coverage and quality across cities, the figures presented are based on extrapolated financial data covering all 4,824 cities. Among these, 2,541 cities (approximately 60%) possess 3 years of contiguous data (2019–20 to 2021–22) in Cityfinance platform. Data from these cities have been systematically extrapolated using the ’per capita scaling methodology’ to reflect the financial performance of the complete set of 4,824 cities. Learn more about the extrapolation methodology here.
This post comes from the team behind the City Finance platform. We spend our days digging into city financial data to bring you insights like this one.
India is undergoing rapid urbanisation. An ever-growing urban population necessitates an increase in urban services and infrastructure. The quality and sustainability of this urban infrastructure and services hinge fundamentally on the sound management of municipal finances, as it enables cities to plan, fund, and maintain essential services adequately.
Post the 15th Finance Commission, the breakthrough that CityFinance platform has brought about in municipal finance data availability is transformative, creating new opportunities for transparency, accountability, and informed decision-making. Yet, as promising as this progress is, the journey would be far from complete without standardizing the available data.
Comparing financial data across cities becomes nearly impossible when one municipality measures revenue in one classification system while another uses an entirely different structure, much like trying to compare distances when one city reports in kilometres and another in miles, using different starting points and routes.
Standardizing municipal finance data is, therefore, the next crucial step to unlock its full potential.
From Fragmentation to Clarity: Unifying Municipal Financial Records
When municipal finance data was made publicly available on CityFinance.in, users encountered a vast but unwieldy pool of information. Data was technically accessible, yet functionally fragmented, locked behind inconsistent formats, conflicting definitions, and incompatible templates.
Significant variations remained in the reporting of municipal finance data. For example, in Tamil Nadu’s cities, data is submitted in three different formats across Municipal Corporations, Town Panchayats and Municipalities. In Odisha, cities such as Bhubaneswar, Hinjlicut, and Baripada each use varying codes and accounting structures. Similarly, cities in Punjab, across Municipal Corporations and Municipalities, do not fully adhere to the NMAM chart of accounts and codes. These variations hinder cross-city comparisons, benchmarking, and in-depth fiscal analysis, as differing terminologies, classifications, and accounting bases create opaque and inconsistent datasets.
Navigating Progress and Overcoming Hurdles in Municipal Data Alignment
Recognizing these barriers, the CityFinance platform has made significant strides toward harmonizing accounting formats and promoting the broader adoption of standardized reporting aligned with NMAM(National Municipal Accounting Manual).
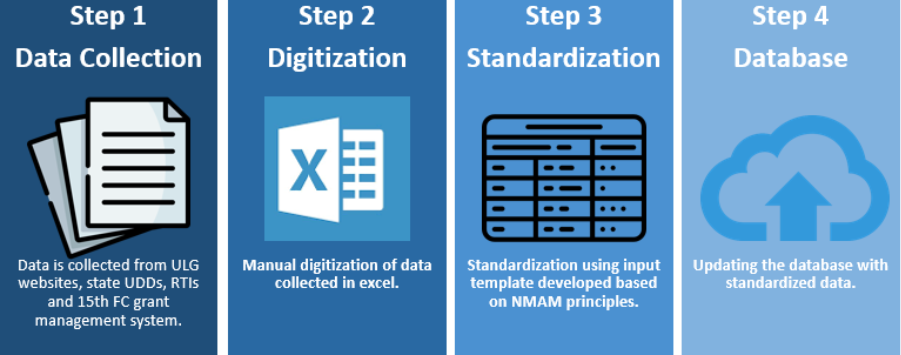
CityFinance platform’s four-step process streamlines the journey from scattered city ledgers to a unified database, making reliable municipal financial analysis accessible to all stakeholders. Following this process, the data is organized into standardized files containing 77-line items grouped under four heads – income, expenditure, assets, and liabilities – in accordance with National Municipal Accounting Framework established by MoHUA.
Through this process, substantial progress has been made: Standardized financial data for at least one year is now available for 89% of India’s ULGs on the CityFinance platform. This standardized format enables multiple analytical lenses: state-wise comparisons, temporal studies, ULG-specific assessments, cross ULG comparisons, population category-based analyses, ULG type-wise evaluations and much more.
Looking at the graph above, over 86% of ULGs with populations above 1 million have four years of standardized data from 2019–2023. This focus on larger cities has been intentional—they handle higher volumes of revenue and expenditure and serve a substantial share of India’s urban population, making their data vital for scalable insights and policy design.
The above chart highlights multiple barriers to data standardization across ULGs. These errors underscore the need for stronger guidance and technical support to improve data submission standards.
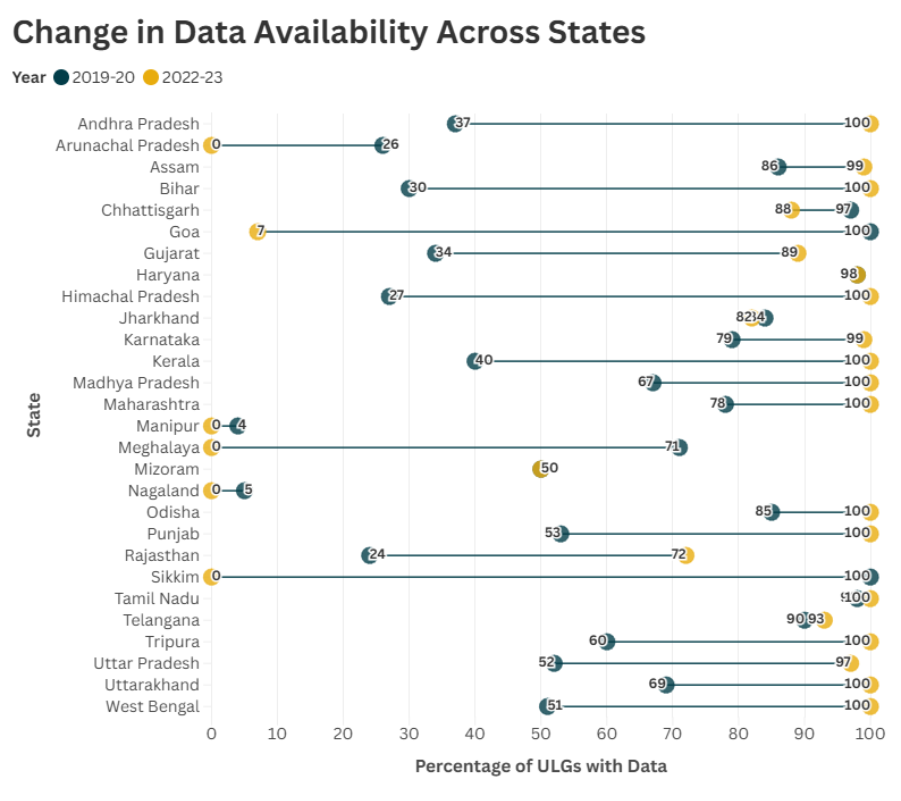
The map below reveals that over 10 states have 90% of ULGs data standardized, others, such as Haryana, Meghalaya, and Sikkim, lag significantly behind.
The Power of Clean Data: Driving Smarter Urban Governance
Standardized municipal finance data is the cornerstone of effective governance. It equips policymakers with reliable fiscal information to design targeted policies, allocate resources effectively and benchmark performance across cities.
Standardized data empowers cities to assess their financial health, monitor compliance, and improve service delivery. It enables evidence-based planning, better budgeting, and performance benchmarking across peers.
For state and national government officials, standardized municipal finance data provides a reliable basis for monitoring fiscal performance, designing incentive frameworks, and targeting capacity-building efforts. It enables cross-ULG benchmarking, compliance tracking, and policy evaluation at scale.
For market participants i.e. credit rating agencies, investors, and financial institutions – standardized data enhances visibility into municipal creditworthiness, enabling risk assessment, debt structuring, and investment in instruments like municipal bonds with greater confidence.
Standardized municipal finance data offers researchers and civic organizations a consistent, comparable foundation to analyze urban fiscal trends, governance outcomes, and equity in resource allocation. Civil society groups can use this data to monitor public spending, engage constructively with local governments, and push for reforms grounded in evidence and public interest.
Breaking Barriers: Building a Resilient Municipal Finance Data Ecosystem
Standardized municipal finance data has begun to reshape urban fiscal governance, enabling smarter policy, better financial management, and more informed understanding.
However, this is just the beginning. The next frontier lies in tapping directly into ULG systems to automate data exchange and eliminate manual reporting and duplication. Integrating technologies like APIs and accessing centralized accounting systems can ensure seamless, timely, and accurate data flows. Alongside this, targeted capacity-building for municipal officials and stronger enforcement of reporting standards will be critical to sustaining data quality and expanding coverage. CityFinance is actively working to enable this shift.
Have you ever wondered, during your daily commute to work, why some roads are in such poor condition, or why certain neighbourhoods lack proper footpaths or decent parks? You would have thought about the property taxes you pay and questioned where exactly all that money goes. These are important, everyday concerns for many urban residents, but finding clear answers isn’t always straightforward.
The key to these questions lies in one place: your city’s financial data. Municipal finance data tells us how much money our city has, where it comes from, what this money is spent on, whether this money is enough and if the money is reaching the right places.
When this data is open and accessible, it does more than just satisfy curiosity of the urban residents. It empowers citizens, strengthens accountability, and enables better decision-making. Transparent financial data builds trust, as citizens see how their contributions are used, and it lays the foundation for cities to plan and deliver services that cater to the people’s needs. But where do we get this data from?
Lost in the Ledger: The municipal finance data scenario before reform
A few years ago, before the 15th Finance Commission in 2021, uncovering a city’s finances was a complicated and taxing process. To get access to municipal finance data of your city, you would need to file a Right to Information (RTI) request and hope for a timely response. Whatever information provided would be recorded in formats unique to each urban local body, often as poorly scanned documents, making it difficult to interpret or compare. This data would often be inconsistent, incomplete, ambiguous, outdated, and unstructured, further complicating the challenge of understanding municipal finances.
Even once you managed to decode these financial statements, a bigger challenge loomed: there were no guarantees about the accuracy or credibility of the data. You were left relying entirely on the word of Urban Local Government, with little means to verify the facts. Comparing your city’s financial performance with another’s, whether for benchmarking, advocacy, or policymaking was nearly impossible.
Reform in Action: City Finance
Recognizing the deep-rooted challenges in municipal finance data – scattered sources, inaccessible information, and no standardization, the 15th Finance Commission introduced a set of game-changing recommendations aimed squarely at transparency and accountability. These reforms demanded that Urban Local Governments publish audited financial accounts in the public domain in a credible and timely manner.
Giving these reforms a practical backbone, the CityFinance platform was adopted and launched by Ministry of Housing and Urban Affairs (MoHUA) in May 2020. This centralized portal became the national conduit for gathering, validating, and publishing municipal finance data for over 4,800 cities. CityFinance bridged these historic gaps, by serving as a single source of truth, automating the sourcing and analysis of financial information from thousands of Urban Local Governments. For the first time now, cities across India can be meaningfully compared, studied, and supported, moving from fragmented ledgers to a living, integrated financial platform.
Bits and Bytes of Progress: The status of data now
Building on the nationwide reforms of the 15th Finance Commission and the launch of it’s compliance module CityFinance, cities across India are now able to share a wider and more meaningful range of financial documents. Through its dashboards and resource modules, CityFinance now provides access to over 15,000 raw financial statements covering 99% of the ULGs in India.
At the heart of modern municipal financial disclosure are audited annual accounts, which ensure transparency, financial integrity, and accountable urban governance. These comprise:
Balance Sheet – presents a city’s assets and liabilities as of the end of the fiscal year.
Income and Expenditure Statement – summarizes financial performance over the year.
Cash Flow Statement – shows the inflows and outflows of cash, revealing how funds are generated and spent.
Auditor’s Report – offers an independent evaluation of the financial statements’ accuracy and reliability.
In India, audits of Urban Local Governments are conducted either by external Chartered Accountants or by the State’s Local Fund Audit Department (LFAD). This audit process forms a vital phase in the municipal finance cycle, reinforcing credibility and trust in city-level financial management. Together, these documents provide a reliable picture of whether cities can cover their obligations, the sufficiency of available funds, and how resources are being allocated across service priorities.
As a result of 15th Financial Commission’s mandate and CityFinance, cities are now institutionalizing structured processes to ensure that audited financial statements are compiled and published on time marking a significant shift from ad hoc disclosures to routine, systematized financial reporting. This shift not only improves compliance with reform mandates but also strengthens the foundation for long-term fiscal discipline and public accountability.
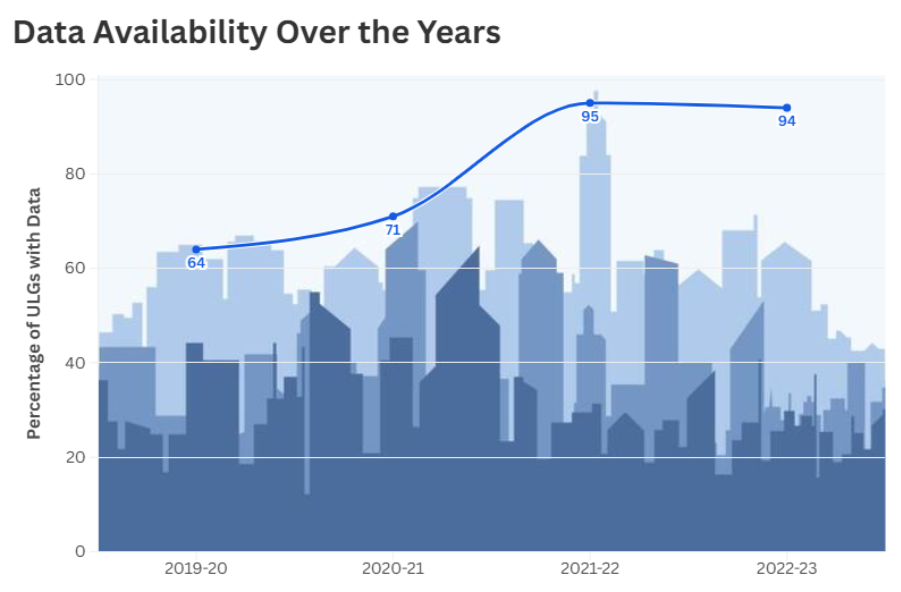
Looking at the figure, we can see that the percentage of Urban Local Governments submitting financial data has seen a dramatic rise, from just 64% in 2019-20 to 94% in 2022-23, reflecting the impact of the 15th Financial Commission’s reforms and the CityFinance platform. This steady increase in the number of cities submitting their financial statements, shows that more cities than ever are embracing transparency and public accountability in the way they manage their finances.
The above chart highlights the dramatic improvement in municipal data availability across Indian states, with 12 states reaching 100% coverage for Urban Local Governments by 2022-23 compared to much lower levels in 2019-20. The progress underscores the power of the focused financial transparency initiatives in bridging information gaps and enabling robust, evidence-driven urban governance.
From Raw Numbers to Real Impact: How Diverse Stakeholders Can Harness Municipal Data
Before CityFinance, municipal financial data was locked behind complicated processes, multiple requests, physical visits, and discretionary approvals, with no guarantee of receiving the desired information. Now, datasets of Urban Local Governments are universally available, empowering a diverse and growing set of stakeholders to examine municipal finance data without enduring a taxing process that may not provide the necessary information. However, for the data to truly benefit these stakeholders, it must be provided in accessible and usable formats.
For government officials, from municipal commissioners to state administrators, the new availability of reliable financial data is transforming how cities are governed. Improved fiscal reporting makes it possible not only to track spending but also to benchmark performance against other ULGs and across states highlighting strengths and gaps. This data-fuelled transparency fosters peer learning across municipalities.
With nearly 95% of Urban Local Governments now submitting financial statements and data available across states, citizens, researchers, and market participants can meaningfully engage with municipal finances. The CityFinance database, covering over 15,600 statements from over 4,800 Urban Local Governments, empowers citizens to track local spending, supports rigorous policy analysis, and enables investors and rating agencies to assess city-level financial health, fostering transparency, innovation, and informed urban investment.
In this way, open and actionable data empowers every stakeholder, from city hall to the community to the marketplace, to be more effective, responsive, and engaged in shaping the future of urban India.
The Way Forward
India’s progress in municipal finance data has unlocked new levels of transparency, empowered a wide range of stakeholders, and driven smarter decisions for urban governance. Yet, the inconsistency in formats and practices across Urban Local Governments still limits comparability, leaving much potential untapped. While audited financial statements offer a retrospective view of actuals, budget data reveals a city’s fiscal intent; how it plans to mobilize and allocate resources across priorities To provide a complete picture of the financial health of our cities, we need to capture and analyse its budget data, covering receipts, expenditures, and key fiscal indicators across years. This work is underway on CityFinance, building the foundation for a more holistic understanding of city finances that goes beyond isolated datasets.
The path forward is clear: standardized, unified reporting is crucial for leveraging municipal finance data to its fullest. Better enforcement of common frameworks will enable better benchmarking, more equitable financing, and reliable insights across cities. This next step, harmonizing data standards, will be the focus of future discussions as Indian cities continue their transformation.
Stay tuned for a deeper look at how CityFinance’s work on data standardization is helping cities unlock comparable, actionable and reform-ready municipal finance insights.
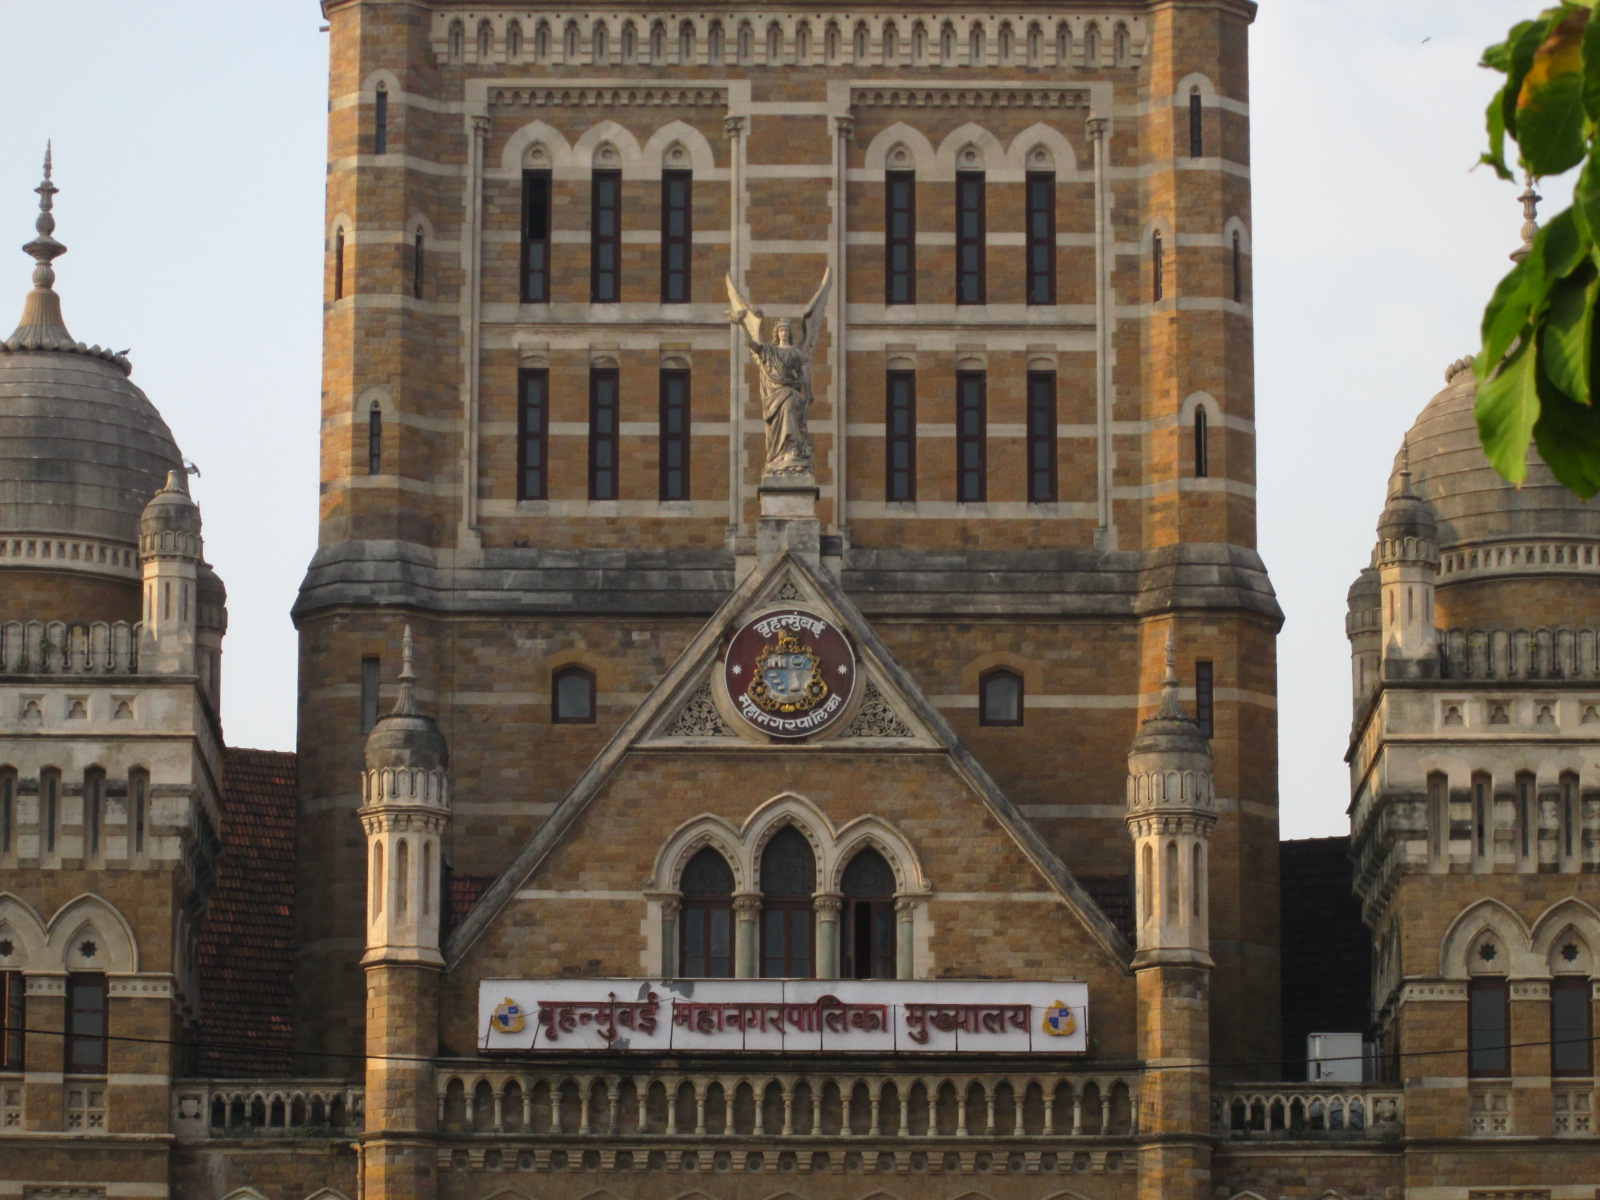
To explore how you can engage with this data, head on to our Resources section for explainers, best practices and tools designed to make municipal finance accessible and actionable. For a detailed example of data available from Urban Local Governments, exploreBrihanmumbai Municipal Corporation’s (Mumbai) municipal finance data on CityFinance.
—
Image credit: Wikimedia Commons
This post comes from the team behind the City Finance platform. We spend our days digging into city financial data to bring you insights like this one.
India is going through rapid urbanization. By 2036, our cities will be home to 40% of our population, which is approximately 600 million people. How well we manage our urban transformation will play a crucial role in our path to development. Therefore, we need to build necessary infrastructure that will make our cities liveable, resilient and inclusive.
Every city needs revenue to function and meet the demands of an expanding urban population. Roads need to be built and maintained, water should be available, waste needs to be managed, and public spaces need upkeep. All these cost money. But where does this money come from?
Where Do Cities Get Their Money From?
For our urban local governments, the revenue to run a city comes from a combination of sources, with revenue from taxes forming a critical foundation of municipal finance. Tax revenue gives urban local governments a steady stream of income and consistent cash flow to pay for necessary services.
The urban local governments in India have access to a diverse set of tax instruments. From property tax, water supply and drainage (WSD) tax to entertainment tax, our cities and towns can levy over 14 different types of taxes, each designed to fund specific aspects of urban life or tap into different economic activities within city limits. This gives urban local governments a rich array of options. But is this the reality on the ground?
Recent analysis of 3,377 urban local governments in India for the financial year 2021-22, reveal an interesting picture. (See figure 1)
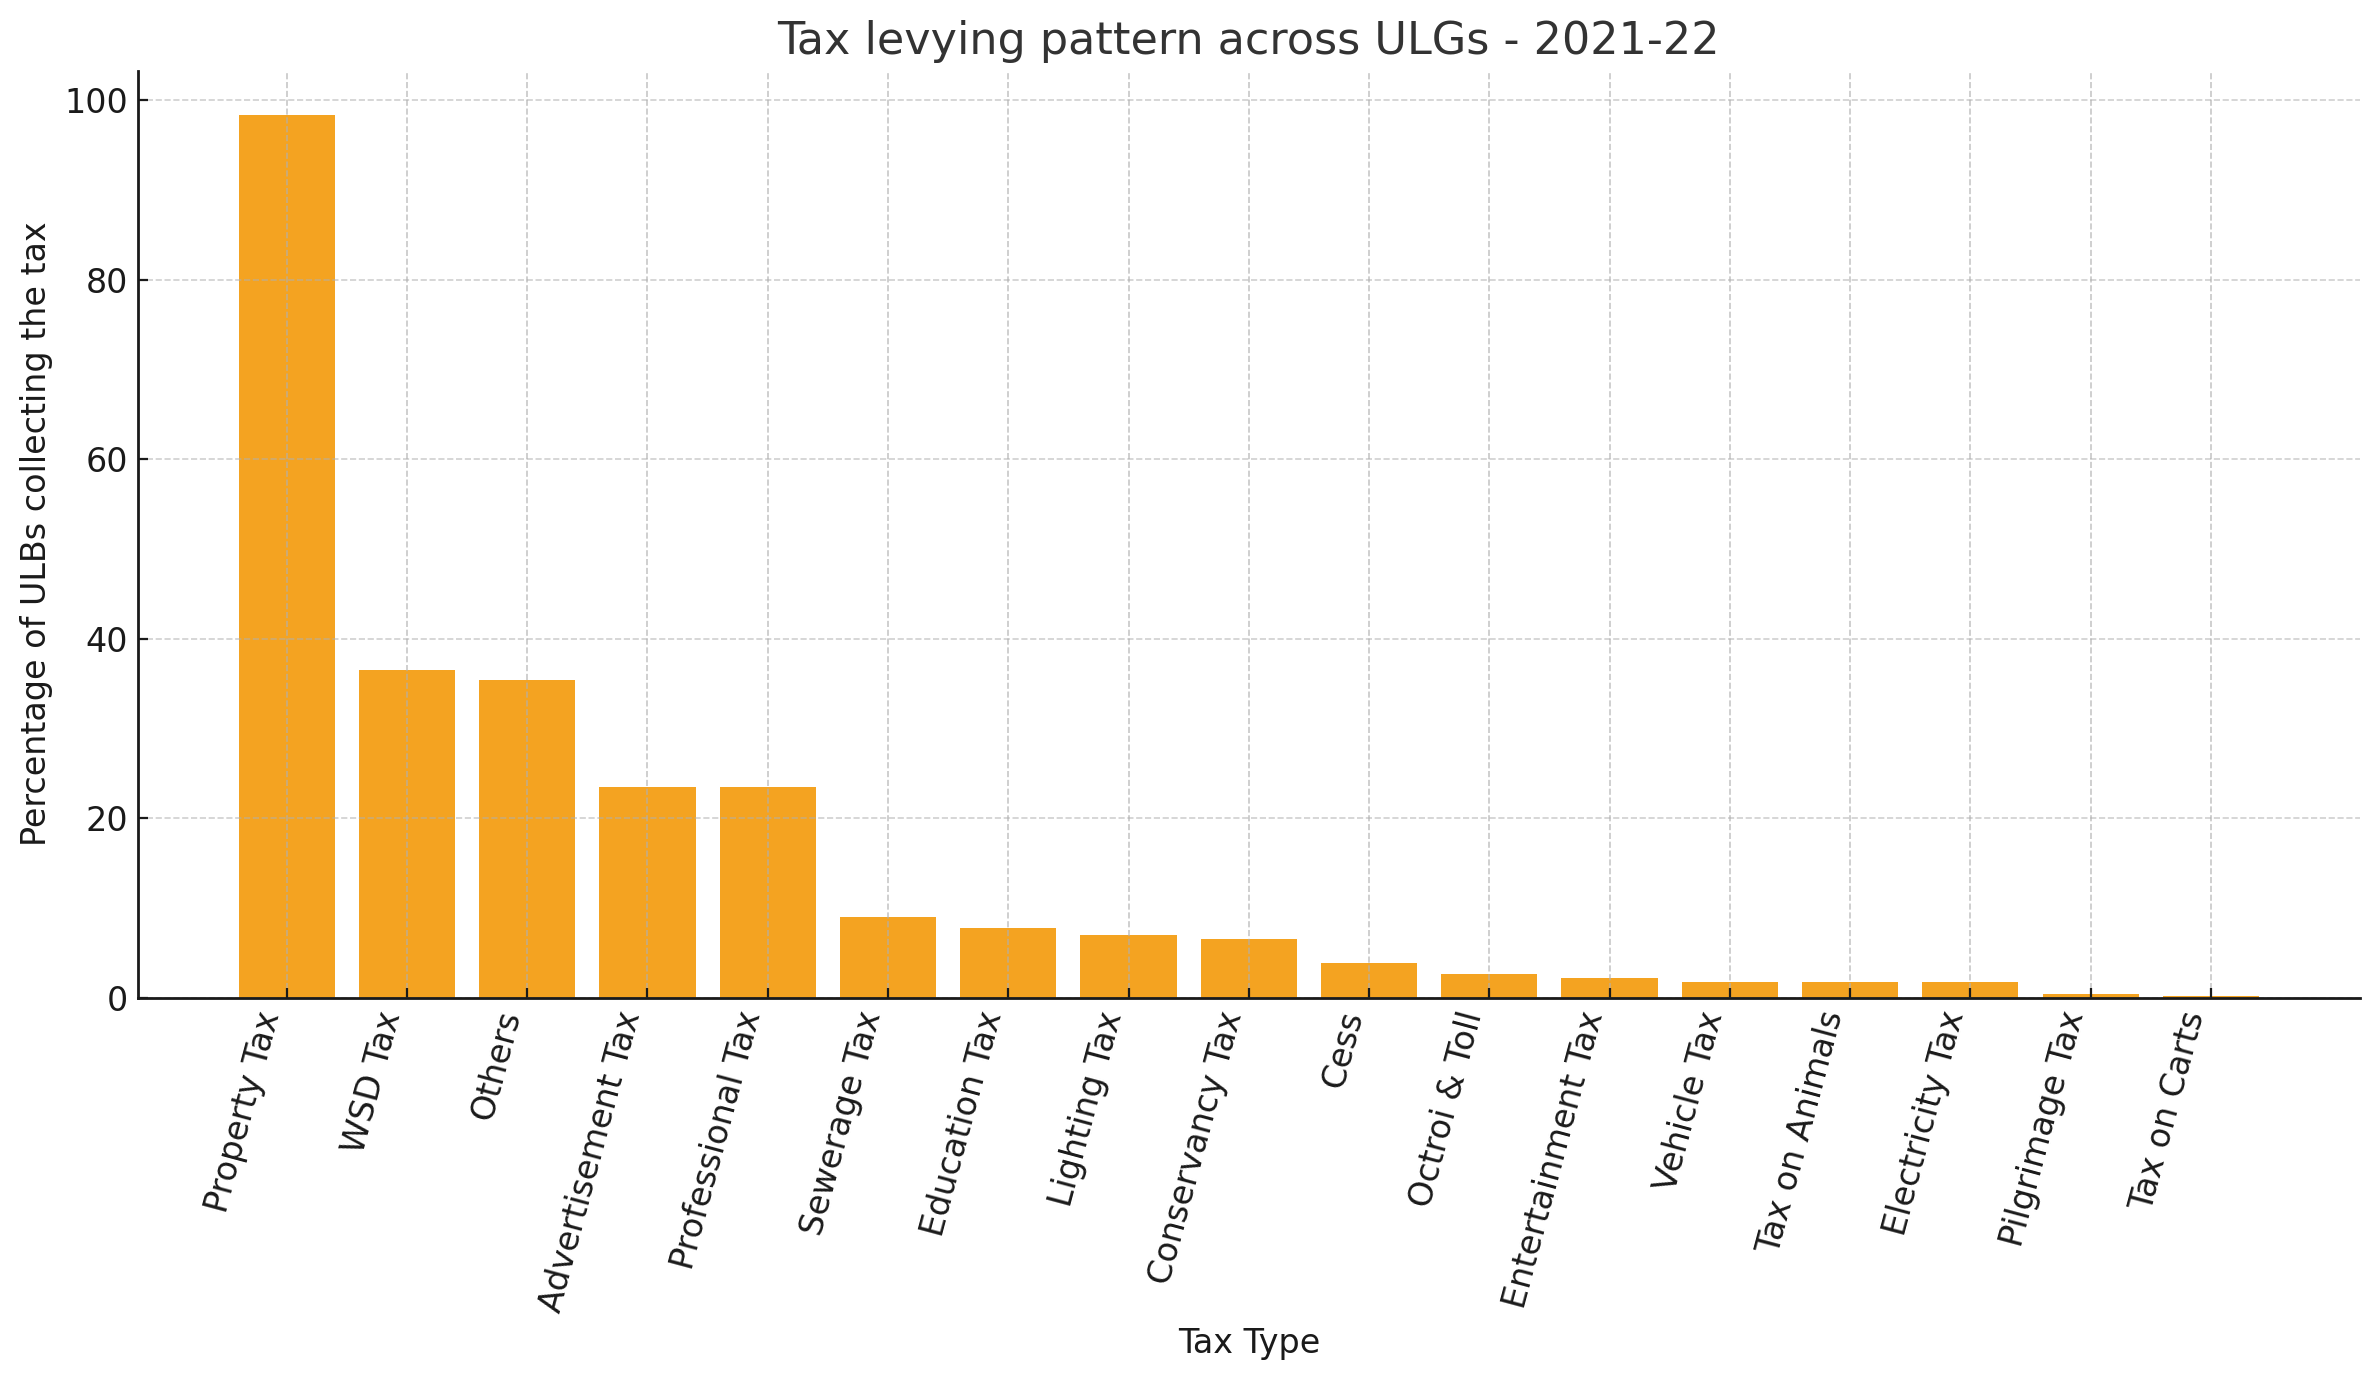
Figure 1
Fig.1 highlights both the dominance of core revenue streams, such as property tax and the underutilization of other tax instruments across urban local governments. With 98% of the urban local governments levying property tax, it is an almost universal source of funding for cities. Water supply and drainage taxes (WSD Tax) are the second most levied tax, levied by about 36% of urban local governments, indicating the significance of utility-based fees in municipal tax revenue portfolios.
Beyond these two dominant revenue sources, adoption falls sharply. Advertisement taxes and professional taxes are each levied by only about 23% of the urban local governments. Other tax instruments like sewerage tax, education tax, lighting tax, and conservancy tax see even more limited adoption, with the percentage of urban local governments levying them dropping to under 10%. Specialized taxes such as entertainment tax, vehicle tax, and electricity tax are utilized by fewer than 100 cities each, and levies like pilgrimage tax or taxes on carts are virtually absent from the municipal revenue landscape.
Tax Diversification Among Urban Local Governments
There are more than 10 different sources of tax revenue that our cities can tap into, but in practice, what is the number of taxes levied by our cities? Let us look at the data from 2021-22.
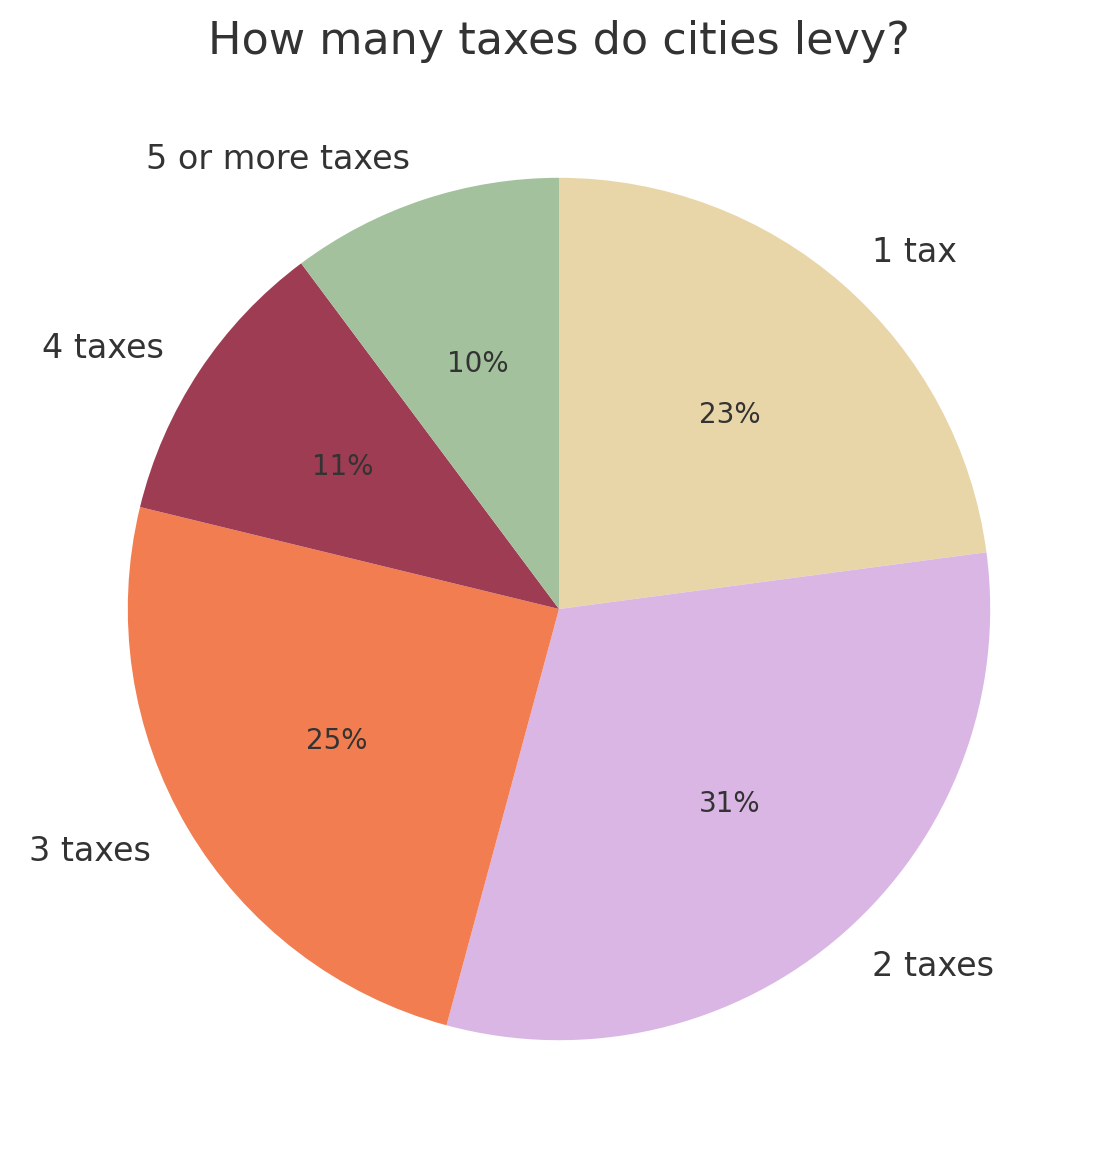
Figure 2
The chart reveals a lack of tax revenue diversification across urban local governments. Out of the 3,377 ULGs we analysed, that levy taxes, nearly one-quarter (23%) of ULGs levy only a single tax – property tax, which often lacks elasticity. This is primarily because once properties are assessed and valuations remain unchanged, the tax base tends to stagnate, particularly in cities with slow construction activity or infrequent revaluations. Thus, while an important and stable source of revenue, property tax can have an inherent ceiling.
Thus, cities that rely solely on property tax risk revenue stagnation, particularly in slower-growing urban areas. A wider tax portfolio can help cities stabilize income across economic cycles, reduce overdependence on a single source, and build stronger fiscal resilience.
The largest proportion of ULGs (31%) levy two taxes, indicating a slightly broader but still limited tax base. Progressively fewer ULGs levy three taxes (25%) or four taxes (11%), while only 10% of ULGs have achieved broader diversification by levying five or more taxes.
Unlocking Cities’ Fiscal Potential
The variation across Indian cities reflects a complex interplay of structural, administrative, and political factors.
Many urban local governments (ULGs) lack the technological systems, trained personnel and digital infrastructure needed to administer a diverse set of taxes especially in smaller cities. But capacity alone doesn’t explain the full picture.
State-level regulations and frameworks also shape what cities can legally levy, and these frameworks vary widely. Despite the 74th Constitutional Amendment Act mandating the devolution of functions to ULBs, many core urban services such as water supply, sanitation remain under the control of state-run parastatals. This limits the fiscal autonomy of cities and diminishes their ability to levy service-linked taxes.
Local enforcement capabilities, political considerations and taxpayer resistance also contribute to the patterns we observe. A city may have the legal authority to levy a particular tax but lack enforcement at the local level, or it may face administrative challenges in levying taxes from informal sectors. Together, these factors point to the truth that many Indian cities have significant untapped potential that remains locked behind barriers of capacity, mandate, and implementation.
Expanding the tax mix is not simply a matter of passing new bylaws or issuing notifications. It requires building systems for property and business assessment that can accurately identify tax bases and calculate liabilities. As mentioned in the property tax toolkit, cities need efficient valuation, assessment and billing mechanisms that can reach taxpayers reliably and modern payment systems that make compliance convenient. Effective collection processes, including follow-up on delinquencies and enforcement mechanisms, are essential to ensure that levied taxes generate revenue. Beyond infrastructure and systems, cities need comprehensive capacity-building initiatives that provide technical support, facilitate peer learning, share best practices from successful urban local governments, and help cities overcome specific implementation challenges they face.
Looking into the tax revenue data of Indian cities reveals some intriguing patterns that need deeper investigation: Why do only 36% of cities levy water supply and drainage taxes when water infrastructure is a universal urban need? How do these patterns in tax revenue change from state to state? Which cities levy 5 or more types of taxes? What are they doing differently from other cities? How will the composition look for cities across different population categories or city types? These are some interesting questions to think about.
These patterns in municipal tax data offer more than just numbers; they hint at deeper questions about how cities govern, what they prioritize and where reform might begin.
To explore the data further, dive deeper into city-level insights, or see where your city stands head to our homepage and start exploring.
This post comes from the team behind the City Finance platform. We spend our days digging into city financial data to bring you insights like this one.
Cities shape our everyday lives and understanding how they’re funded, how they spend and how they plan for the future is important. Financial data of cities is often hard to find, harder to interpret and rarely presented in ways that invite public engagement and discourse.
cityfinance.in was created to change that.
As India’s national open platform for urban financial transparency, the CityFinance platform brings together key financial information from cities across the country. It helps users explore annual financial statements & budgets and compare financial performance – all in one place. Whether you’re a city official, a researcher, a journalist or simply curious about how cities work, the platform offers tools to make urban finance more visible and understandable.
This blog will evolve alongside the platform. As more financial data and features become available, we’ll surface the stories behind the numbers that can reveal about city’s urban priorities, pressures and possibilities. Financial transparency isn’t just about accountability—it’s about enabling informed civic participation and evidence-based policymaking.
Over time, this space will offer a record of how CityFinance platform grows – not just as a tool, but as part of a broader shift toward clarity, usability and fiscal reform in city governance.