Tag: revenue composition

  • Inside the Revenue Mix: What Makes Up a City’s Own Source Revenue? 

    Inside the Revenue Mix: What Makes Up a City’s Own Source Revenue? 

    A city’s fiscal autonomy is only as strong as the revenue it generates on its own and, as our last blog post showed, that autonomy is far from evenly distributed. But what exactly makes up that revenue?

    In our previous blog post, we explored how Own Source Revenue (OSR) is generated across cities of different sizes and states. OSR is not a single revenue stream; it is a combination of different revenue components that Urban Local Governments (ULGs) generate through their taxation powers, service delivery functions and assets. Each of these components contributes differently, shaping the overall structure of municipal own revenue.
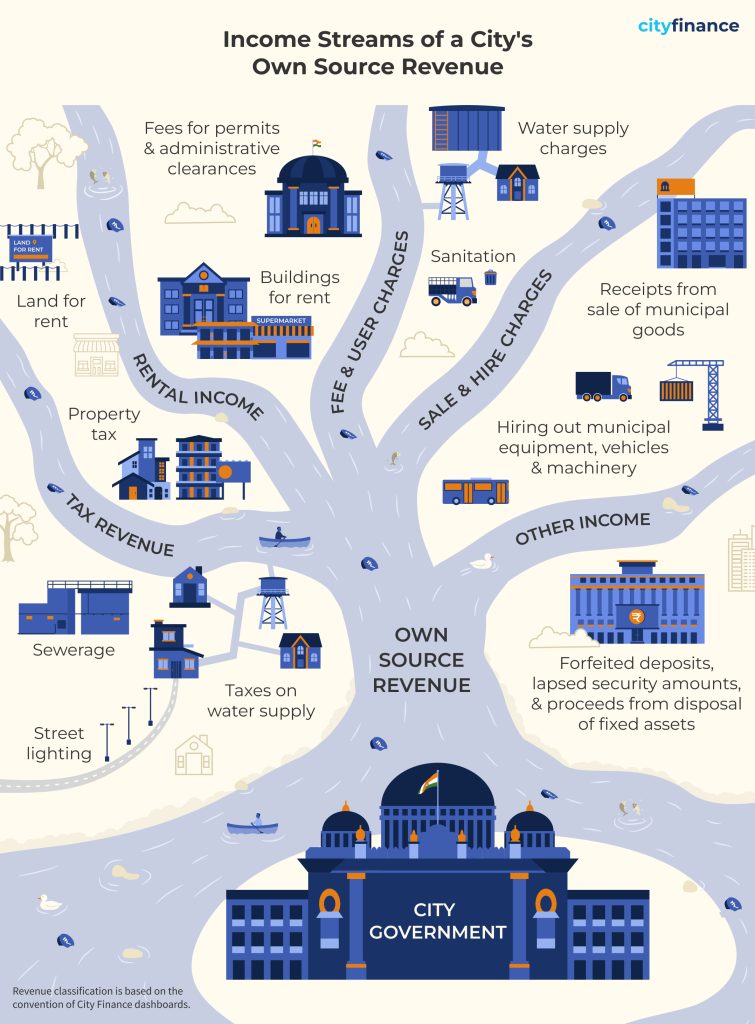
    At its core, OSR comprises two broad categories: tax and non-tax revenue. Tax revenue is dominated by property tax, alongside levies on water supply, sewerage, conservancy, street lighting, education, and other municipal services. 

    Non-tax revenue is more diverse and includes fees and user charges for services such as water supply, sanitation, and solid waste management, as well as payments for licenses, permits, and regulatory approvals. Other important components include sale and hire charges, generated from the sale of municipal goods and the hiring of municipal equipment or vehicles, and rental income from leasing municipal assets such as shops, markets, community halls, and land. 

    OSR also includes a residual category termed ‘other income,’ comprising receipts such as forfeited deposits, employee recoveries, disposal of assets, and various accounting adjustments. Unlike taxes and user charges, these receipts are often irregular and unpredictable. 

    The average composition of Own Source Revenue of Indian ULGs across FY 2019–20 to FY 2021–22 highlights the continued dominance of tax revenue, which accounts for half of total OSR. Fees and user charges constitute the second-largest component at 32 per cent, underscoring the importance of service-linked non-tax revenues in municipal finances. Other income contributes 14 per cent, while rental income (3 per cent) and sale and hire charges (1 per cent) together form a relatively small share. Overall, the revenue mix suggests that municipal finances remain anchored in taxation, with non-tax sources, particularly fees and user charges, playing an important, complementary role in strengthening local revenue generation. 

    From Small Towns to Megacities: A Telling Revenue Picture

    FY 2021–22 data shows that tax revenue remains the primary source of OSR for most Indian cities. The notable exception is 4-million-plus cities (4M+ cities), where fees and user charges account for the largest share (47 per cent). 4M+ cities and cities with population less than 100K show a relatively higher share of ’other income’. In contrast, sale and hire charges remain marginal across all city categories. 

    ULGs of a majority of Indian states exhibit limited diversification in their OSR structures, with heavy reliance on tax revenue and fees and user charges. In 12 out of 24 states analysed, these two sources together account for more than 75 per cent of total OSR. Rental income remains a minor contributor in most states, averaging around 15 per cent across the sample. Sale and hire charges are negligible almost universally, rarely exceeding 10 per cent. 

     Key Takeaways 

    The composition of a city’s Own Source Revenue tells a story not just of how much OSR it raises, but of how it raises it and how sustainably it can do so. Across Indian states, the picture is one of limited diversification, a heavy reliance on tax revenue and fees and user charges, with rental income and other receipts remaining largely untapped.  

    Improving Own Source Revenue is not just about diversifying revenue streams. It demands strengthening collection efficiency within existing sources, rationalising fee structures, and reducing dependence on a narrow own revenue base. Achieving this, however, demands skills and capacities that many ULGs, particularly smaller ones, currently lack. Hence, strengthening local capacity is an equally important priority.  As cities face growing expenditure pressures, building a more resilient and self-sufficient municipal finance system is not just a fiscal imperative, it is foundational to delivering better urban services and stronger local governance. 

    Stay tuned for a closer look at the key components of Own Source Revenue of cities.  

    Note: All data is sourced from the Annual Financial Statements submitted by the ULGs on the CityFinance platform. To ensure comprehensive representation and account for variations in data coverage and quality across cities, the figures presented are based on extrapolated financial data covering all 4,824 cities. Among these, 2,541 cities (approximately 60%) possess 3 years of contiguous data (2019–20 to 2021–22) in Cityfinance platform. Data from these cities have been systematically extrapolated using the ’per capita scaling methodology’ to reflect the financial performance of the complete set of 4,824 cities. Learn more about the extrapolation methodology here.  

  • Unpacking Urban Revenue Composition 

    Unpacking Urban Revenue Composition 

    In our previous blog on total revenue of Indian cities, we explored how total revenues vary dramatically across Indian cities, with resources concentrated in major metropolitan areas. But these total revenue figures reveal only a part of the story.  

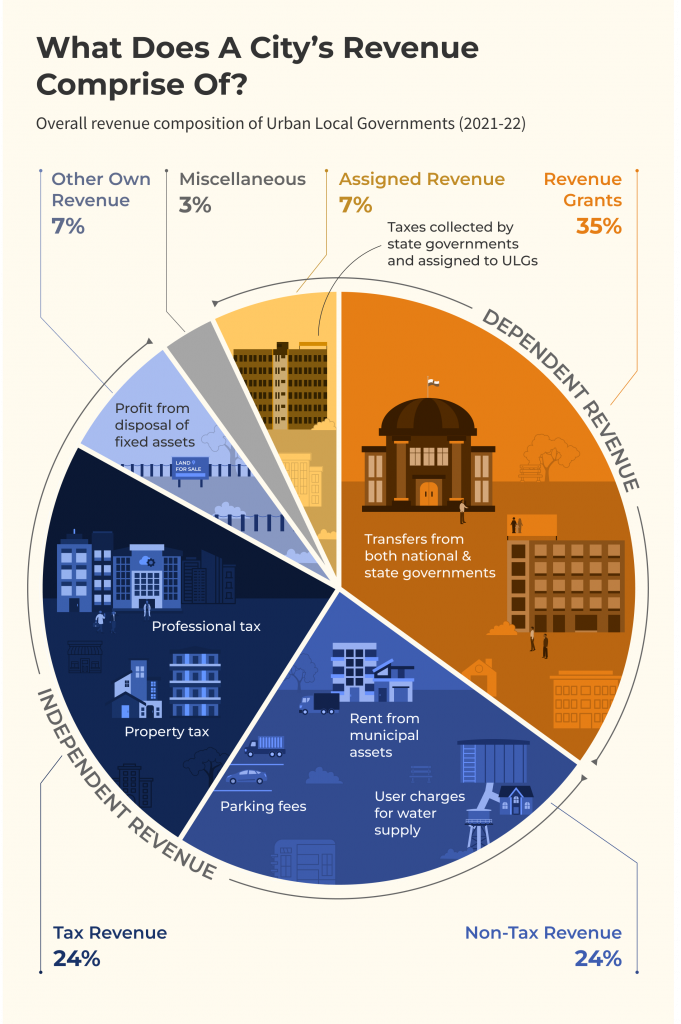
    Understanding where that revenue comes from is equally important. The composition of a city’s revenue, how much it raises on its own versus how much it receives from higher tiers of government, speaks directly to its fiscal autonomy, financial resilience, and capacity for self-determined growth. Examining revenue composition thus moves the conversation beyond how much cities earn to how they earn it.

    As shown in the figure above, at the national level, the composition of municipal revenues exhibits a substantial share of grant revenue across ULGs. However, when we look at the graph below, we can see that this share is comparatively lower for million-plus cities. CityFinance data shows that larger ULGs, particularly million-plus cities, demonstrate a stronger own-source revenue base, supported by both tax and non-tax revenues, relative to smaller cities. 

    Although million-plus cities receive significant volumes of grants, these constitute a smaller proportion of their total revenue when compared to smaller ULGs. This reflects the larger revenue base of metropolitan cities, where tax and non-tax revenues contribute a greater share to overall municipal finances. 

    Notably, 4M+ cities show a relatively higher share of non-tax revenue within their revenue. This indicates a more diversified revenue composition with contributions from user charges, fees, rentals, and other service-related income streams alongside tax revenue. In contrast, smaller ULGs exhibit a relatively higher dependence on revenue grants within their overall revenue structure. 

    Overall, the data highlights variation in revenue composition across city size categories, reflecting differences in revenue structure and scale across urban India. 

    When compared with the national profile, state-wise regional variation becomes much more evident for FY 2021-22. 

    Northern states such as Uttar Pradesh (80% grants), Uttarakhand (84%), and Bihar (67%) show grant shares well above the national aggregate composition, with relatively lower tax and non-tax contributions. In contrast, southern states display a different composition: Telangana records 48% tax revenue and Andhra Pradesh 42% tax revenue, while Tamil Nadu shows a more balanced mix with 29% tax revenue and 34% grants. Gujarat and Maharashtra also exhibit less dependence on grants when compared to national aggregate composition.  

    Overall, the comparison reflects regional differences in revenue structure relative to the national composition, highlighting variation across India’s urban fiscal landscape.

    The Way Forward

    The analysis underscores that revenue profile of cities in India cannot be understood through aggregate revenue figures alone. A deeper look at revenue composition reveals important distinctions. While the proportion of intergovernmental grants in revenue composition of smaller cities remains higher, larger cities continue to receive higher per capita grants. The findings suggest that million-plus cities show higher collection of own-source revenue. Assigned revenue on the other hand decreased consistently which is a trend that warrants closer examination. The variations across states further reinforce that fiscal outcomes are influenced by governance structures, devolution frameworks and accounting practices.  

    Moving beyond aggregate figures to examine how city revenues are composed will offer a far more comprehensive understanding of where Indian cities stand fiscally and what it will take to strengthen their financial foundations. 

    In our next blog, we turn to Own Source Revenue performance across city categories and states and what it reveals about the fiscal health of India’s urban local governments. Stay tuned. 

    Note: All data is sourced from the Annual Financial Statements submitted by the ULGs on the CityFinance platform. To ensure comprehensive representation and account for variations in data coverage and quality across cities, the figures presented are based on extrapolated financial data covering all 4,824 cities. Among these, 2,541 cities (approximately 60%) possess 3 years of contiguous data (2019–20 to 2021–22) in Cityfinance platform. Data from these cities have been systematically extrapolated using the ’per capita scaling methodology’ to reflect the financial performance of the complete set of 4,824 cities. Learn more about the extrapolation methodology here.