Tag: own source revenue

  • Inside the Revenue Mix: What Makes Up a City’s Own Source Revenue? 

    Inside the Revenue Mix: What Makes Up a City’s Own Source Revenue? 

    A city’s fiscal autonomy is only as strong as the revenue it generates on its own and, as our last blog post showed, that autonomy is far from evenly distributed. But what exactly makes up that revenue?

    In our previous blog post, we explored how Own Source Revenue (OSR) is generated across cities of different sizes and states. OSR is not a single revenue stream; it is a combination of different revenue components that Urban Local Governments (ULGs) generate through their taxation powers, service delivery functions and assets. Each of these components contributes differently, shaping the overall structure of municipal own revenue.
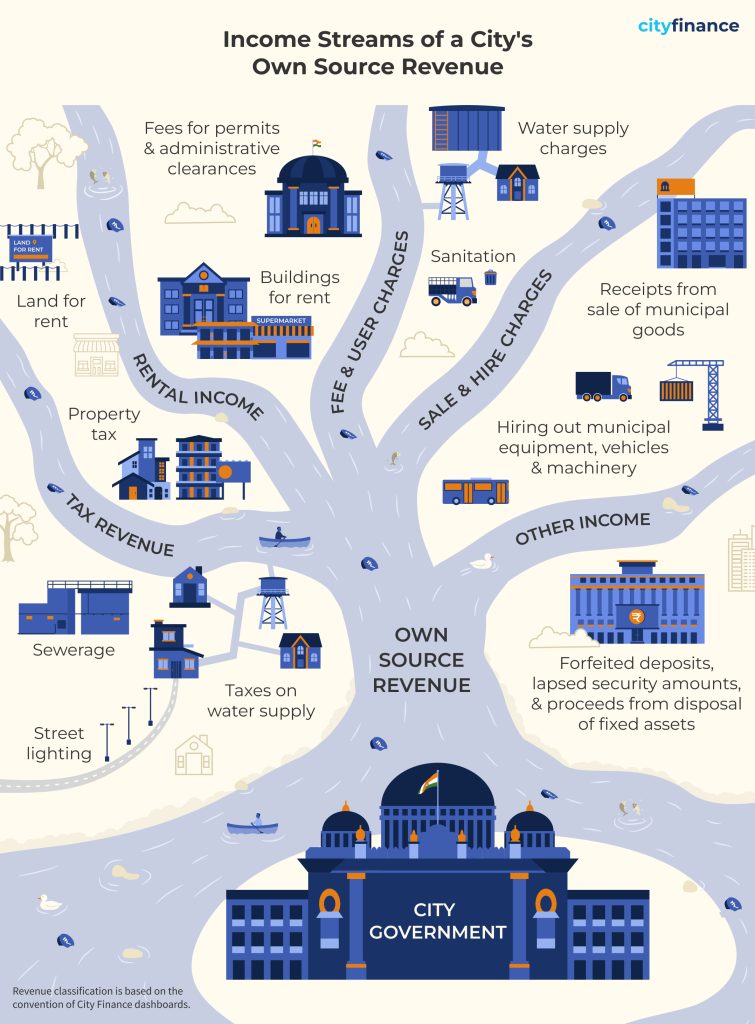
    At its core, OSR comprises two broad categories: tax and non-tax revenue. Tax revenue is dominated by property tax, alongside levies on water supply, sewerage, conservancy, street lighting, education, and other municipal services. 

    Non-tax revenue is more diverse and includes fees and user charges for services such as water supply, sanitation, and solid waste management, as well as payments for licenses, permits, and regulatory approvals. Other important components include sale and hire charges, generated from the sale of municipal goods and the hiring of municipal equipment or vehicles, and rental income from leasing municipal assets such as shops, markets, community halls, and land. 

    OSR also includes a residual category termed ‘other income,’ comprising receipts such as forfeited deposits, employee recoveries, disposal of assets, and various accounting adjustments. Unlike taxes and user charges, these receipts are often irregular and unpredictable. 

    The average composition of Own Source Revenue of Indian ULGs across FY 2019–20 to FY 2021–22 highlights the continued dominance of tax revenue, which accounts for half of total OSR. Fees and user charges constitute the second-largest component at 32 per cent, underscoring the importance of service-linked non-tax revenues in municipal finances. Other income contributes 14 per cent, while rental income (3 per cent) and sale and hire charges (1 per cent) together form a relatively small share. Overall, the revenue mix suggests that municipal finances remain anchored in taxation, with non-tax sources, particularly fees and user charges, playing an important, complementary role in strengthening local revenue generation. 

    From Small Towns to Megacities: A Telling Revenue Picture

    FY 2021–22 data shows that tax revenue remains the primary source of OSR for most Indian cities. The notable exception is 4-million-plus cities (4M+ cities), where fees and user charges account for the largest share (47 per cent). 4M+ cities and cities with population less than 100K show a relatively higher share of ’other income’. In contrast, sale and hire charges remain marginal across all city categories. 

    ULGs of a majority of Indian states exhibit limited diversification in their OSR structures, with heavy reliance on tax revenue and fees and user charges. In 12 out of 24 states analysed, these two sources together account for more than 75 per cent of total OSR. Rental income remains a minor contributor in most states, averaging around 15 per cent across the sample. Sale and hire charges are negligible almost universally, rarely exceeding 10 per cent. 

     Key Takeaways 

    The composition of a city’s Own Source Revenue tells a story not just of how much OSR it raises, but of how it raises it and how sustainably it can do so. Across Indian states, the picture is one of limited diversification, a heavy reliance on tax revenue and fees and user charges, with rental income and other receipts remaining largely untapped.  

    Improving Own Source Revenue is not just about diversifying revenue streams. It demands strengthening collection efficiency within existing sources, rationalising fee structures, and reducing dependence on a narrow own revenue base. Achieving this, however, demands skills and capacities that many ULGs, particularly smaller ones, currently lack. Hence, strengthening local capacity is an equally important priority.  As cities face growing expenditure pressures, building a more resilient and self-sufficient municipal finance system is not just a fiscal imperative, it is foundational to delivering better urban services and stronger local governance. 

    Stay tuned for a closer look at the key components of Own Source Revenue of cities.  

    Note: All data is sourced from the Annual Financial Statements submitted by the ULGs on the CityFinance platform. To ensure comprehensive representation and account for variations in data coverage and quality across cities, the figures presented are based on extrapolated financial data covering all 4,824 cities. Among these, 2,541 cities (approximately 60%) possess 3 years of contiguous data (2019–20 to 2021–22) in Cityfinance platform. Data from these cities have been systematically extrapolated using the ’per capita scaling methodology’ to reflect the financial performance of the complete set of 4,824 cities. Learn more about the extrapolation methodology here.  

  • Exploring the Fiscal Autonomy of Cities with CityFinance.in: A Beginner’s Guide

    Exploring the Fiscal Autonomy of Cities with CityFinance.in: A Beginner’s Guide

    This Fiscal Autonomy Primer marks the third edition in a multi-part series on the financial data of cities hosted on CityFinance.in. Each edition in the series will spotlight one key fiscal indicator, offering a focused analysis to demonstrate the different kinds of insights that can be drawn from the data and how they inform a deeper understanding of urban finance. This initiative aims to foster greater understanding and engagement with the financial data of Indian cities, with the broader goal of enabling deeper analysis and further research in this critical area. In this edition, we will be looking at a crucial parameter that determines a city’s financial stability: Own Source Revenue.

    What if India’s cities could only spend what they earned? For most Urban Local Governments (ULGs), this would mean dramatic cuts to essential services, revealing a dependence on state and central transfers rather than self-generated revenue. A deeper examination of the Own Source Revenue (OSR) patterns of cities is therefore crucial to enhance urban financial sustainability across India.

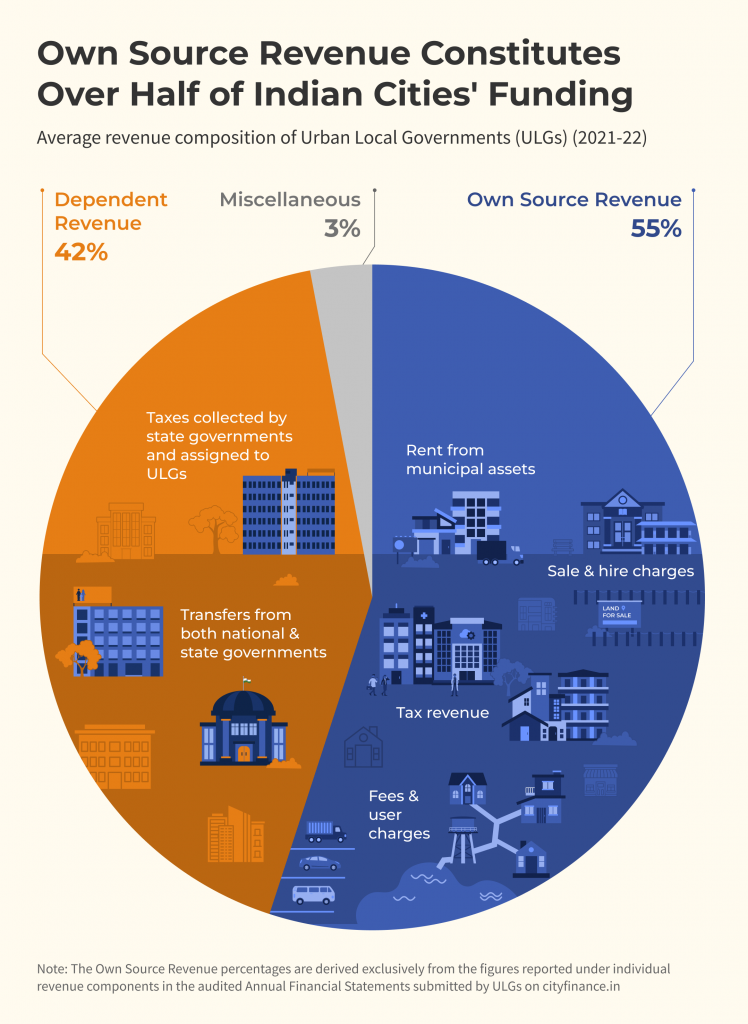
    Own Source Revenue refers to the income that ULGs generate independently through their own taxation powers, service and other charges. It comprises tax revenue, revenue from fees and user charges, sale and hire charges, rental income from municipal properties, and other sources of income that is not coming from central or state governments.

    The data reveals that Own Source Revenue contributed around half of aggregate total revenue of ULGs in FY 2021-22. While this trend appears encouraging at the aggregate level, a closer look at OSR composition across cities of varying sizes is warranted. 

    A clear pattern emerges: larger cities consistently outperform smaller ones in generating their own revenue.

    Geography of Fiscal Self-Reliance 

    The geographic variation in OSR performance across cities of different sizes and states suggests that outcomes are shaped by a confluence of factors, including levels of urbanisation, economic base, state-level fiscal frameworks, and administrative capacity. However, strong OSR figures must be interrogated further: the critical question is whether these own revenue gains are resulting in measurably better services for urban residents.

    Beyond Taxes, Fees and User Charges: Improving Fiscal Autonomy

    Improving fiscal autonomy requires more than just strengthening tax collection and rationalising fees and user charges. ULGs can meaningfully expand their fiscal autonomy through municipal bonds and public-private partnerships. 

    A municipal bond is a marketable debt instrument where a ULG borrows funds from investors for a defined period at a fixed or variable interest rate. The funds raised can be used for infrastructure development. This allows ULGs to access money immediately while paying it back through future revenues, helping them attract long-term capital, build credit profiles, and bring greater accountability and transparency to citizens.  

    However, municipal bonds remain severely underutilised – only 22 ULGs have issued bonds since the Securities and Exchange Board of India (SEBI) released its guidelines in 2015. The promise of municipal bonds can only be realised if ULGs are genuinely equipped to use them. This calls for enhanced fiscal discipline, robust financial processes, stronger institutional capacity at the local level, and more structured engagement with private partners through Public-Private Partnerships (PPPs). Without these enabling conditions, municipal bonds will remain an instrument available on paper but out of reach in practice for the vast majority of India’s cities.

    Bridging the Gap: The Road Ahead

    The OSR patterns and the extent of use of instruments like municipal bonds collectively point to an urban fiscal landscape where the capacity for self-finance is heavily skewed toward larger cities with better capacities, leaving smaller ULGs disproportionately dependent on grants and transfers. Bridging this gap will require targeted interventions, modernising tax systems, rationalising fees and user charges, and building administrative capacity in smaller cities. Without deliberate and sustained reforms to strengthen municipal revenue systems at the grassroots, the promise of genuine urban financial autonomy will remain concentrated at the top, widening, rather than narrowing, the divide between India’s metro giants and its smaller cities.

    Stay tuned for a deeper look into Own Source Revenue of cities.

    Note: All data is sourced from the Annual Financial Statements submitted by the ULGs on the CityFinance platform. To ensure comprehensive representation and account for variations in data coverage and quality across cities, the figures presented are based on extrapolated financial data covering all 4,824 cities. Among these, 2,541 cities (approximately 60%) possess 3 years of contiguous data (2019–20 to 2021–22) in Cityfinance platform. Data from these cities have been systematically extrapolated using the ’per capita scaling methodology’ to reflect the financial performance of the complete set of 4,824 cities. Learn more about the extrapolation methodology here.