Tag: fiscal reforms

  • Paying for the Service: Unpacking Fees and User Charges in India’s Largest Cities 

    Paying for the Service: Unpacking Fees and User Charges in India’s Largest Cities 

    When was the last time you paid your city directly for something, not a tax, but a fee for a specific service or approval? If you can’t quite remember, you’re not alone. Most citizens interact with municipal fees, and user charges constantly yet rarely notice them as a distinct and surprisingly large source of city revenue. 

    In our previous blog, we broke down Own Source Revenue (OSR) into its building blocks and found that fees and user charges form its second-largest component nationally, accounting for an average of 32 per cent of the total. This blog post takes a closer look at that component: what fees and user charges consist of, and how their composition plays out across some of India’s largest cities. 

    What Counts as a Fee, What Counts as a Charge 

    A fee is a levy by ULGs for performing specific statutory and regulatory functions, while a user charge is a payment for the usage of a municipal service, often linked directly to the consumption or utilisation of that service. According to the National Municipal Accounts Manual (NMAM), fees include licensing fees, fees for grant of permit, fees for certificate or extract, regularisation fees, penalties and fines, entry fees, and other fees while user charges include empanelment and registration charges, development charges, service/administrative charges, and other charges.

    Conceptually, user charges are meant to recover at least a portion of the operation and maintenance costs of municipal services such as water supply, sanitation, solid waste management, and parking. Fees, on the other hand, are intended to compensate ULGs for regulatory and administrative functions, including licensing, inspection, certification, and approvals. In practice, however, the distinction between the two is often blurred in municipal accounts. 

    An examination of fee and user charge revenues in India’s largest cities – Mumbai, Bengaluru, Chennai, Hyderabad, Kolkata, Surat, Ahmedabad, and Pune*, shows that these revenue streams function not only as instruments of service pricing, but also as a reflection of how cities govern and finance urban services. 

    Fees, User Charges, and the Wider OSR Picture 

    Zooming out to the full Own Source Revenue base, tax revenue emerges as the largest contributor in six of the eight cities, with fees and user charges forming the next most significant stream. 

    Two cities stand apart from this pattern. In Mumbai, OSR is shaped not only by taxes and fees and user charge revenue but also by a substantial share of other (miscellaneous) income. In Surat, fees and user charges surpass tax revenue altogether to become the single largest component of OSR, pointing to a comparatively stronger reliance on service and regulation-linked receipts. 

    An Even Divide: Fees vs. User Charges Across India’s Largest Cities 

    The data reveals an even divide across the eight cities. Mumbai, Surat, Ahmedabad and Pune derive a larger share of this revenue from user charges, while Hyderabad, Chennai, Bengaluru and Kolkata rely more on fees. This pattern suggests that the former group leans relatively more on service-linked revenue streams, while the latter mobilises a greater proportion of its income through regulatory and permission-based functions. 

    Same Categories, Different Priorities

    Across cities, the composition of fees and user charges reflects the different functional pathways through which ULGs mobilise their Own Source Revenue. 

    Major User Charges StreamsCityWhat This Reveals
    Development Charges Hyderabad, Bengaluru, Mumbai, Surat, Pune, and AhmedabadStrong reliance on urban planning approvals, land development processes, and infrastructure-related contributions. 
    User ChargesBengaluru, Mumbai, Kolkata, and SuratSanitation, water services, health-related services, and other civic amenities form an important basis for recurring municipal income.
    Service/Administrative ChargesChennaiRevenue flowing from engineering oversight, supervisory roles and administrative processes rather than direct service consumption. 
    Major FeesCityWhat This Reveals
    Fees for Grant of Permits Hyderabad, Chennai, Kolkata and AhmedabadRevenue generation through development control, construction approvals, and transport or logistics regulation.
    Licensing Fee Bengaluru and Pune Revenues from market regulation and commercial activity permissions, linking fiscal flows to public health oversight and civic compliance mechanisms. 
    Regularisation Fees Mumbai and KolkataRevenues arise from post-facto compliance and corrective planning measures.
    Other FeesMumbai, Surat, and Ahmedabad Reflecting property record administration (mutation and transfer charges), tax enforcement documentation (notice and warrant fees), utility service connections, and civic facility charges (advertisement, tuition, survey fees).

    Taken together, these patterns suggest that while some cities monetise growth and regulatory authority, others rely more strongly on service-linked revenue streams, illustrating the varied ways ULGs translate their functional responsibilities into Own Source Revenue. 

    Key Takeaways 

    The 74th Constitutional Amendment laid out a comprehensive framework for municipal fiscal empowerment, and the functions listed in the Twelfth Schedule potentially create multiple opportunities for fees and user charges. But constitutional empowerment alone does not guarantee fiscal outcomes. Translating that potential into actual own-revenue growth depends on state legislative action, administrative capacity for revenue administration, and clarity in how functional responsibilities are assigned across service areas. 

    As this analysis shows, fees and user charges are far from a monolithic revenue stream; their composition varies as much with how a city governs as with how it grows.

    Stay tuned as we continue this series unpacking the building blocks of India’s municipal finances. 

    *Pune has been included as it is among India’s top cities in terms of population size and municipal financial volume. All the other cities in the analysis are cities with populations above 4 million.

    Note: All data is sourced from the Annual Financial Statements submitted by the ULGs on the CityFinance platform. To ensure comprehensive representation and account for variations in data coverage and quality across cities, the figures presented are based on extrapolated financial data covering all 4,824 cities. Among these, 2,541 cities (approximately 60%) possess 3 years of contiguous data (2019–20 to 2021–22) in Cityfinance platform. Data from these cities have been systematically extrapolated using the ’per capita scaling methodology’ to reflect the financial performance of the complete set of 4,824 cities. Learn more about the extrapolation methodology here.  

  • Inside the Revenue Mix: What Makes Up a City’s Own Source Revenue? 

    Inside the Revenue Mix: What Makes Up a City’s Own Source Revenue? 

    A city’s fiscal autonomy is only as strong as the revenue it generates on its own and, as our last blog post showed, that autonomy is far from evenly distributed. But what exactly makes up that revenue?

    In our previous blog post, we explored how Own Source Revenue (OSR) is generated across cities of different sizes and states. OSR is not a single revenue stream; it is a combination of different revenue components that Urban Local Governments (ULGs) generate through their taxation powers, service delivery functions and assets. Each of these components contributes differently, shaping the overall structure of municipal own revenue.

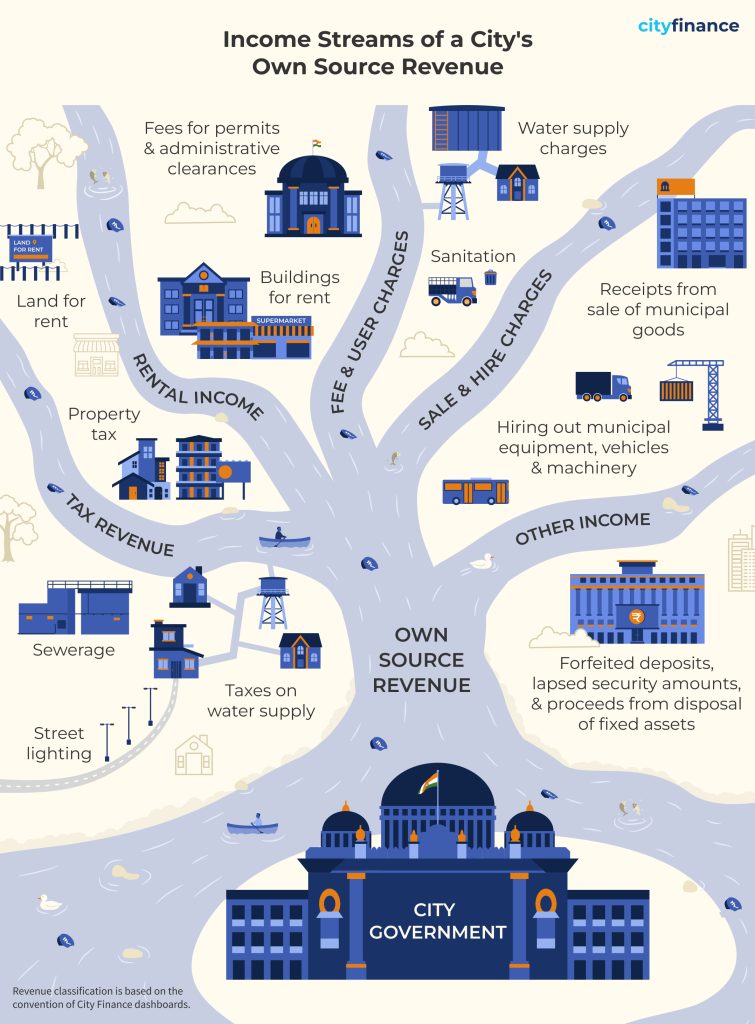
    At its core, OSR comprises two broad categories: tax and non-tax revenue. Tax revenue is dominated by property tax, alongside levies on water supply, sewerage, conservancy, street lighting, education, and other municipal services. 

    Non-tax revenue is more diverse and includes fees and user charges for services such as water supply, sanitation, and solid waste management, as well as payments for licenses, permits, and regulatory approvals. Other important components include sale and hire charges, generated from the sale of municipal goods and the hiring of municipal equipment or vehicles, and rental income from leasing municipal assets such as shops, markets, community halls, and land. 

    OSR also includes a residual category termed ‘other income,’ comprising receipts such as forfeited deposits, employee recoveries, disposal of assets, and various accounting adjustments. Unlike taxes and user charges, these receipts are often irregular and unpredictable. 

    The average composition of Own Source Revenue of Indian ULGs across FY 2019–20 to FY 2021–22 highlights the continued dominance of tax revenue, which accounts for half of total OSR. Fees and user charges constitute the second-largest component at 32 per cent, underscoring the importance of service-linked non-tax revenues in municipal finances. Other income contributes 14 per cent, while rental income (3 per cent) and sale and hire charges (1 per cent) together form a relatively small share. Overall, the revenue mix suggests that municipal finances remain anchored in taxation, with non-tax sources, particularly fees and user charges, playing an important, complementary role in strengthening local revenue generation. 

    From Small Towns to Megacities: A Telling Revenue Picture

    FY 2021–22 data shows that tax revenue remains the primary source of OSR for most Indian cities. The notable exception is 4-million-plus cities (4M+ cities), where fees and user charges account for the largest share (47 per cent). 4M+ cities and cities with population less than 100K show a relatively higher share of ’other income’. In contrast, sale and hire charges remain marginal across all city categories. 

    ULGs of a majority of Indian states exhibit limited diversification in their OSR structures, with heavy reliance on tax revenue and fees and user charges. In 12 out of 24 states analysed, these two sources together account for more than 75 per cent of total OSR. Rental income remains a minor contributor in most states, averaging around 15 per cent across the sample. Sale and hire charges are negligible almost universally, rarely exceeding 10 per cent. 

     Key Takeaways 

    The composition of a city’s Own Source Revenue tells a story not just of how much OSR it raises, but of how it raises it and how sustainably it can do so. Across Indian states, the picture is one of limited diversification, a heavy reliance on tax revenue and fees and user charges, with rental income and other receipts remaining largely untapped.  

    Improving Own Source Revenue is not just about diversifying revenue streams. It demands strengthening collection efficiency within existing sources, rationalising fee structures, and reducing dependence on a narrow own revenue base. Achieving this, however, demands skills and capacities that many ULGs, particularly smaller ones, currently lack. Hence, strengthening local capacity is an equally important priority.  As cities face growing expenditure pressures, building a more resilient and self-sufficient municipal finance system is not just a fiscal imperative, it is foundational to delivering better urban services and stronger local governance. 

    Stay tuned for a closer look at the key components of Own Source Revenue of cities.  

    Note: All data is sourced from the Annual Financial Statements submitted by the ULGs on the CityFinance platform. To ensure comprehensive representation and account for variations in data coverage and quality across cities, the figures presented are based on extrapolated financial data covering all 4,824 cities. Among these, 2,541 cities (approximately 60%) possess 3 years of contiguous data (2019–20 to 2021–22) in Cityfinance platform. Data from these cities have been systematically extrapolated using the ’per capita scaling methodology’ to reflect the financial performance of the complete set of 4,824 cities. Learn more about the extrapolation methodology here.  

  • Open Data, Better Governance: Unlocking Transparency in Municipal Finance Data

    Open Data, Better Governance: Unlocking Transparency in Municipal Finance Data

    Have you ever wondered, during your daily commute to work, why some roads are in such poor condition, or why certain neighbourhoods lack proper footpaths or decent parks? You would have thought about the property taxes you pay and questioned where exactly all that money goes. These are important, everyday concerns for many urban residents, but finding clear answers isn’t always straightforward.  

    The key to these questions lies in one place: your city’s financial data. Municipal finance data tells us how much money our city has, where it comes from, what this money is spent on, whether this money is enough and if the money is reaching the right places.  

    When this data is open and accessible, it does more than just satisfy curiosity of the urban residents. It empowers citizens, strengthens accountability, and enables better decision-making. Transparent financial data builds trust, as citizens see how their contributions are used, and it lays the foundation for cities to plan and deliver services that cater to the people’s needs. But where do we get this data from? 

    Lost in the Ledger: The municipal finance data scenario before reform 

    A few years ago, before the 15th Finance Commission in 2021, uncovering a city’s finances was a complicated and taxing process. To get access to municipal finance data of your city, you would need to file a Right to Information (RTI) request and hope for a timely response. Whatever information provided would be recorded in formats unique to each urban local body, often as poorly scanned documents, making it difficult to interpret or compare. This data would often be inconsistent, incomplete, ambiguous, outdated, and unstructured, further complicating the challenge of understanding municipal finances. 

    Even once you managed to decode these financial statements, a bigger challenge loomed: there were no guarantees about the accuracy or credibility of the data. You were left relying entirely on the word of Urban Local Government, with little means to verify the facts. Comparing your city’s financial performance with another’s, whether for benchmarking, advocacy, or policymaking was nearly impossible.  

    Reform in Action: City Finance  

    Recognizing the deep-rooted challenges in municipal finance data – scattered sources, inaccessible information, and no standardization, the 15th Finance Commission introduced a set of game-changing recommendations aimed squarely at transparency and accountability. These reforms demanded that Urban Local Governments publish audited financial accounts in the public domain in a credible and timely manner.  

    Giving these reforms a practical backbone, the CityFinance platform was adopted and launched by Ministry of Housing and Urban Affairs (MoHUA) in May 2020. This centralized portal became the national conduit for gathering, validating, and publishing municipal finance data for over 4,800 cities. CityFinance bridged these historic gaps, by serving as a single source of truth, automating the sourcing and analysis of financial information from thousands of Urban Local Governments. For the first time now, cities across India can be meaningfully compared, studied, and supported, moving from fragmented ledgers to a living, integrated financial platform.  

    Bits and Bytes of Progress: The status of data now 

    Building on the nationwide reforms of the 15th Finance Commission and the launch of it’s compliance module CityFinance, cities across India are now able to share a wider and more meaningful range of financial documents. Through its dashboards and resource modules, CityFinance now provides access to over 15,000 raw financial statements covering 99% of the ULGs in India.  

    At the heart of modern municipal financial disclosure are audited annual accounts, which ensure transparency, financial integrity, and accountable urban governance. These comprise: 

    • Balance Sheet – presents a city’s assets and liabilities as of the end of the fiscal year. 
    • Income and Expenditure Statement – summarizes financial performance over the year. 
    • Cash Flow Statement – shows the inflows and outflows of cash, revealing how funds are generated and spent. 
    • Auditor’s Report – offers an independent evaluation of the financial statements’ accuracy and reliability. 

    In India, audits of Urban Local Governments are conducted either by external Chartered Accountants or by the State’s Local Fund Audit Department (LFAD). This audit process forms a vital phase in the municipal finance cycle, reinforcing credibility and trust in city-level financial management. Together, these documents provide a reliable picture of whether cities can cover their obligations, the sufficiency of available funds, and how resources are being allocated across service priorities. 

    As a result of 15th Financial Commission’s mandate and CityFinance, cities are now institutionalizing structured processes to ensure that audited financial statements are compiled and published on time marking a significant shift from ad hoc disclosures to routine, systematized financial reporting. This shift not only improves compliance with reform mandates but also strengthens the foundation for long-term fiscal discipline and public accountability. 

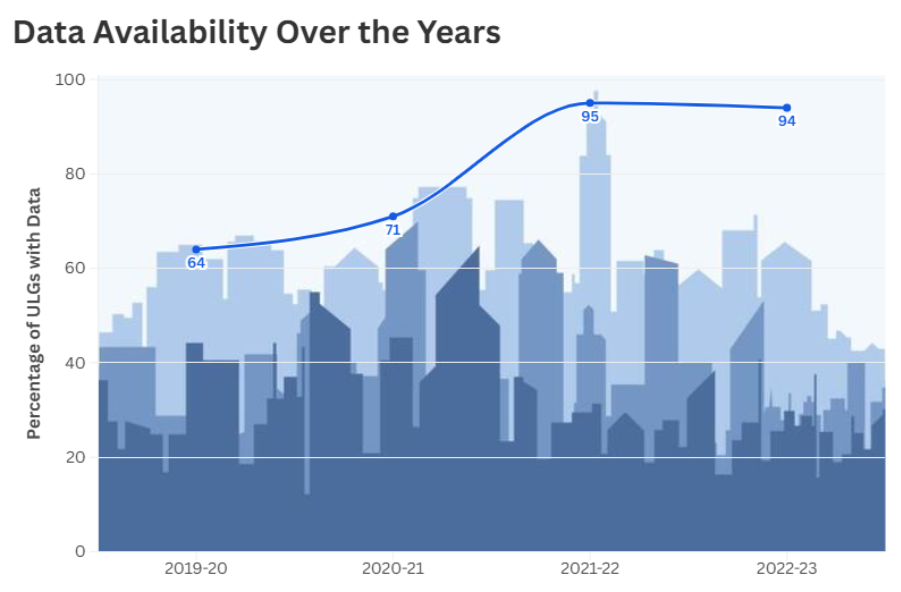
    Looking at the figure, we can see that the percentage of Urban Local Governments submitting financial data has seen a dramatic rise, from just 64% in 2019-20 to 94% in 2022-23, reflecting the impact of the 15th Financial Commission’s reforms and the CityFinance platform. This steady increase in the number of cities submitting their financial statements, shows that more cities than ever are embracing transparency and public accountability in the way they manage their finances. 

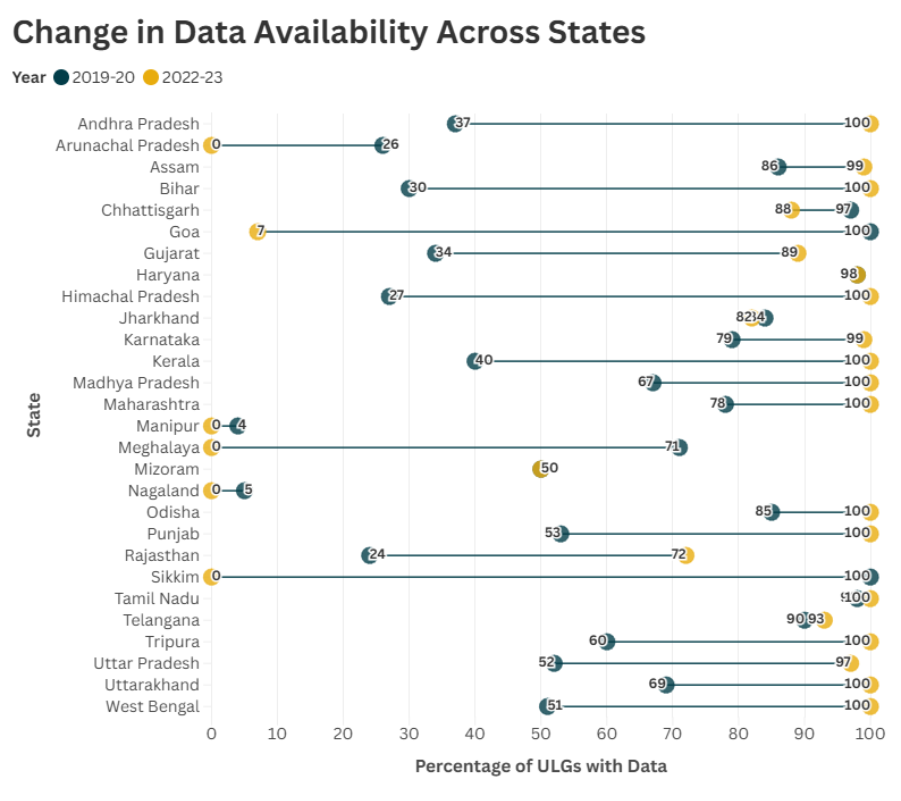
    The above chart highlights the dramatic improvement in municipal data availability across Indian states, with 12 states reaching 100% coverage for Urban Local Governments by 2022-23 compared to much lower levels in 2019-20. The progress underscores the power of the focused financial transparency initiatives in bridging information gaps and enabling robust, evidence-driven urban governance. 

    From Raw Numbers to Real Impact: How Diverse Stakeholders Can Harness Municipal Data 

    Before CityFinance, municipal financial data was locked behind complicated processes, multiple requests, physical visits, and discretionary approvals, with no guarantee of receiving the desired information. Now, datasets of Urban Local Governments are universally available, empowering a diverse and growing set of stakeholders to examine municipal finance data without enduring a taxing process that may not provide the necessary information. However, for the data to truly benefit these stakeholders, it must be provided in accessible and usable formats.   

    For government officials, from municipal commissioners to state administrators, the new availability of reliable financial data is transforming how cities are governed. Improved fiscal reporting makes it possible not only to track spending but also to benchmark performance against other ULGs and across states highlighting strengths and gaps. This data-fuelled transparency fosters peer learning across municipalities. 

    With nearly 95% of Urban Local Governments now submitting financial statements and data available across states, citizens, researchers, and market participants can meaningfully engage with municipal finances. The CityFinance database, covering over 15,600 statements from over 4,800 Urban Local Governments, empowers citizens to track local spending, supports rigorous policy analysis, and enables investors and rating agencies to assess city-level financial health, fostering transparency, innovation, and informed urban investment. 

    In this way, open and actionable data empowers every stakeholder, from city hall to the community to the marketplace, to be more effective, responsive, and engaged in shaping the future of urban India. 

    The Way Forward 

    India’s progress in municipal finance data has unlocked new levels of transparency, empowered a wide range of stakeholders, and driven smarter decisions for urban governance. Yet, the inconsistency in formats and practices across Urban Local Governments still limits comparability, leaving much potential untapped. While audited financial statements offer a retrospective view of actuals, budget data reveals a city’s fiscal intent; how it plans to mobilize and allocate resources across priorities To provide a complete picture of the financial health of our cities, we need to capture and analyse its budget data, covering receipts, expenditures, and key fiscal indicators across years. This work is underway on CityFinance, building the foundation for a more holistic understanding of city finances that goes beyond isolated datasets. 

    The path forward is clear: standardized, unified reporting is crucial for leveraging municipal finance data to its fullest. Better enforcement of common frameworks will enable better benchmarking, more equitable financing, and reliable insights across cities. This next step, harmonizing data standards, will be the focus of future discussions as Indian cities continue their transformation.  

    Stay tuned for a deeper look at how CityFinance’s work on data standardization is helping cities unlock comparable, actionable and reform-ready municipal finance insights.  

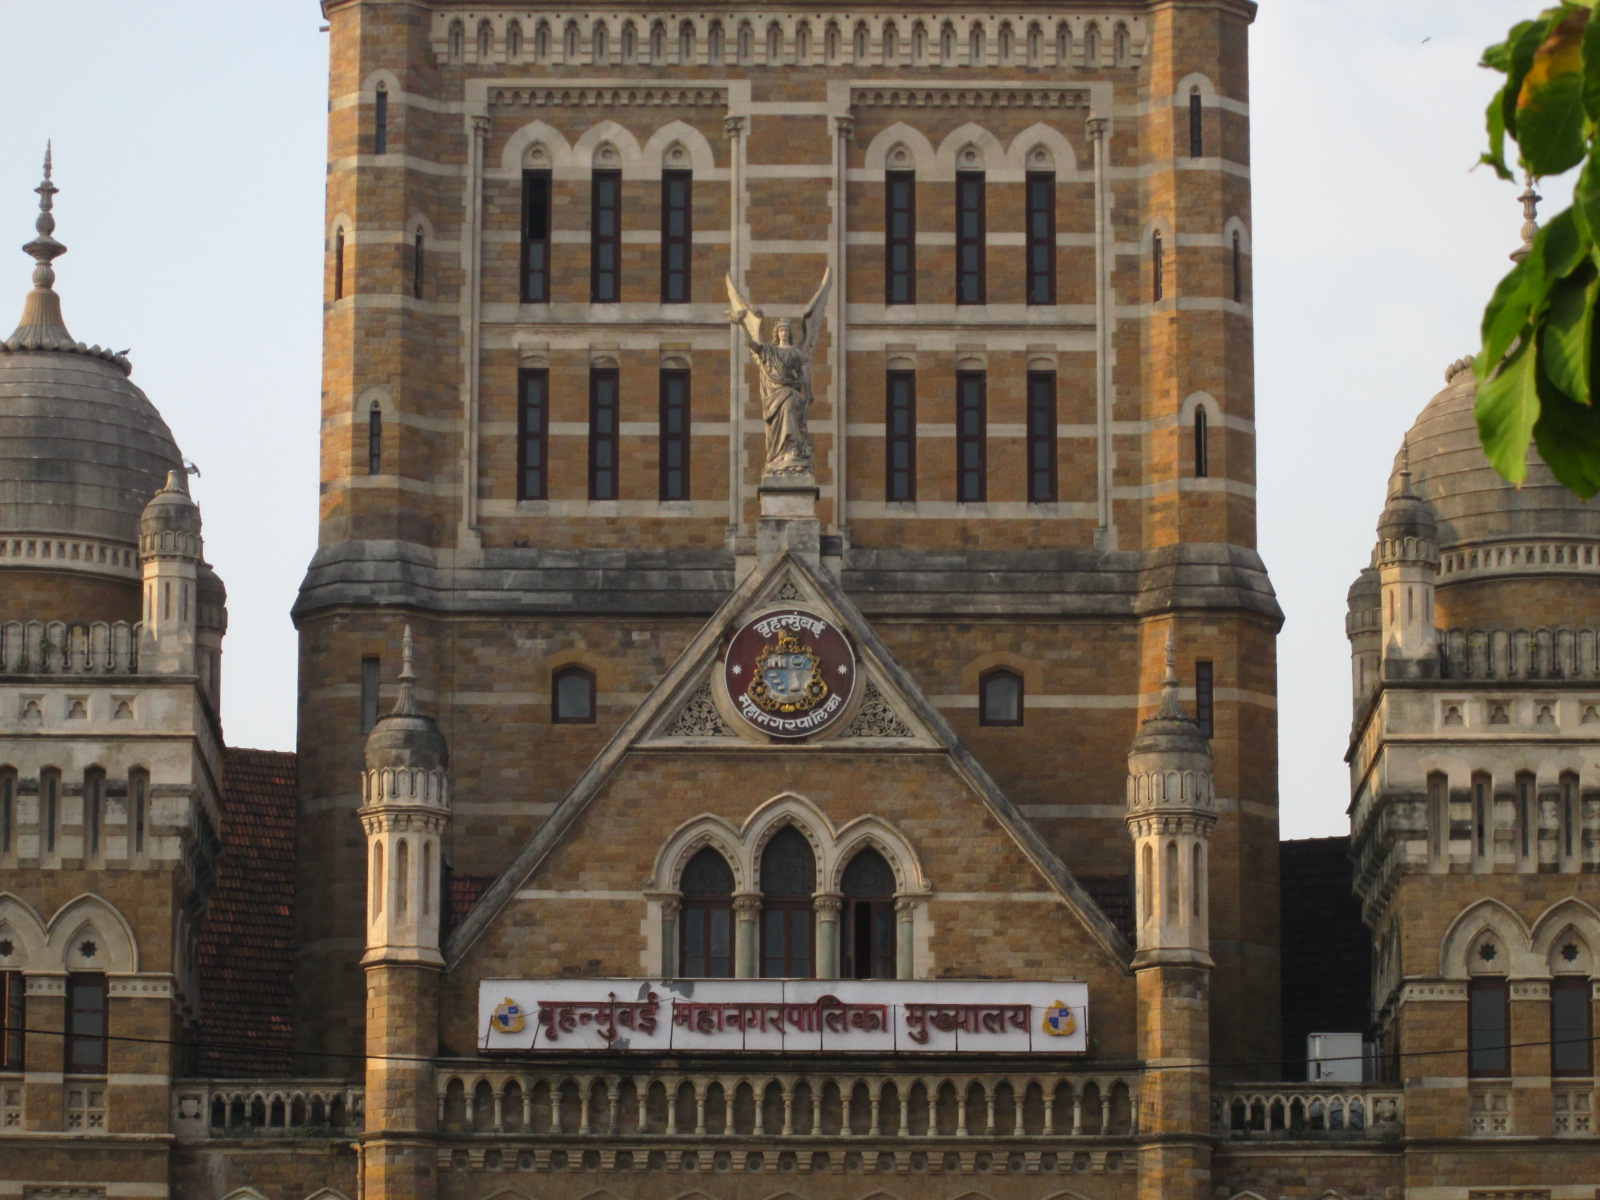
    To explore how you can engage with this data, head on to our Resources section for explainers, best practices and tools designed to make municipal finance accessible and actionable. For a detailed example of data available from Urban Local Governments, explore Brihanmumbai Municipal Corporation’s (Mumbai) municipal finance data on CityFinance.    

    Image credit: Wikimedia Commons


  • Welcome to the CityFinance Blog!

    Cities shape our everyday lives and understanding how they’re funded, how they spend and how they plan for the future is important. Financial data of cities is often hard to find, harder to interpret and rarely presented in ways that invite public engagement and discourse. 

    cityfinance.in was created to change that. 

    As India’s national open platform for urban financial transparency, the CityFinance platform brings together key financial information from cities across the country. It helps users explore annual financial statements & budgets and compare financial performance – all in one place. Whether you’re a city official, a researcher, a journalist or simply curious about how cities work, the platform offers tools to make urban finance more visible and understandable. 

    This blog will evolve alongside the platform. As more financial data and features become available, we’ll surface the stories behind the numbers that can reveal about city’s urban priorities, pressures and possibilities. Financial transparency isn’t just about accountability—it’s about enabling informed civic participation and evidence-based policymaking. 

    Over time, this space will offer a record of how CityFinance platform grows – not just as a tool, but as part of a broader shift toward clarity, usability and fiscal reform in city governance. 

    – From all of us at City Finance