
This Total Expenditure Primer marks the second edition in a multi-part series on the city financial data hosted on CityFinance.in. Each edition in the series will spotlight one key fiscal indicator, offering a focused analysis to demonstrate the different kinds of insights that can be drawn from the data and how they inform a deeper understanding of urban finance. This initiative aims to foster greater understanding and engagement with the financial data of Indian cities, with the broader goal of enabling deeper analysis and further research in this critical area. Here we will be dealing with a crucial parameter that determines a city’s financial stability: Total Expenditure.
What is a City’s Total Expenditure?
Urban infrastructure and services, from street lighting and water supply to road maintenance, are tangible results of a city’s expenditure at work. Understanding how much cities spend, how these funds are allocated, and why significant variations exist across urban centres is essential to evaluating the state of India’s urban governance.
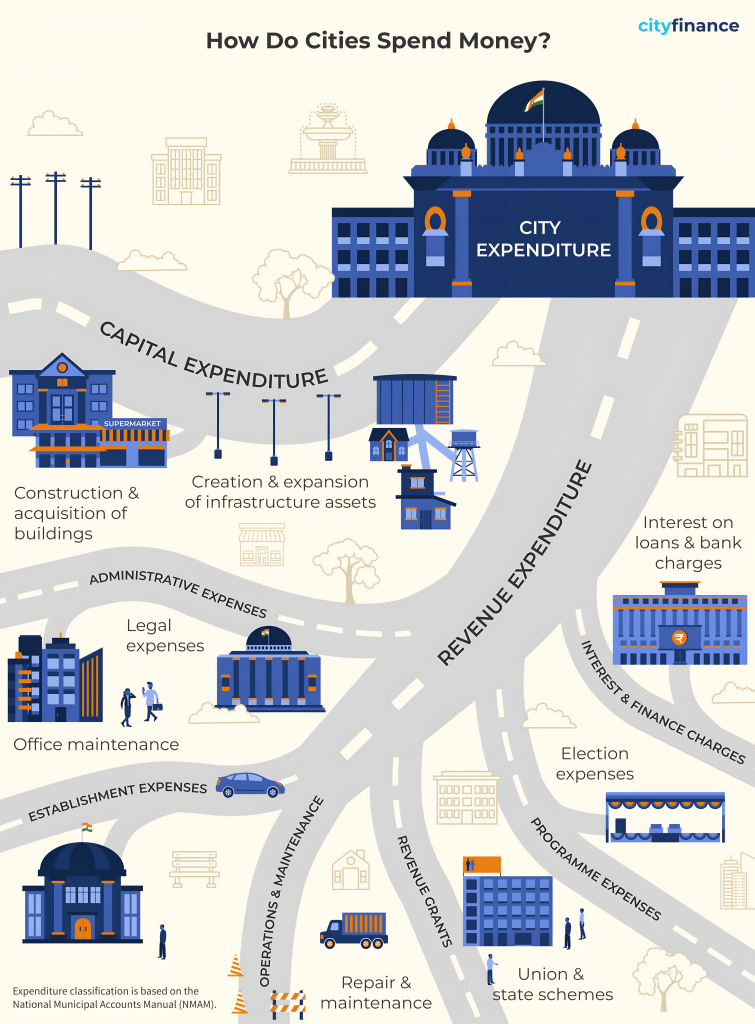
At its simplest, Total Expenditure represents the complete amount of money spent by an Urban Local Government (ULG) during a financial year. It comprises two main components:
- Revenue Expenditure covers the day-to-day operational costs necessary to keep urban services running smoothly.
- Capital Expenditure refers to investments in creating or upgrading long-term infrastructure and assets.
ULG Expenditure Trends: A Decline in Spending (2020-2022)
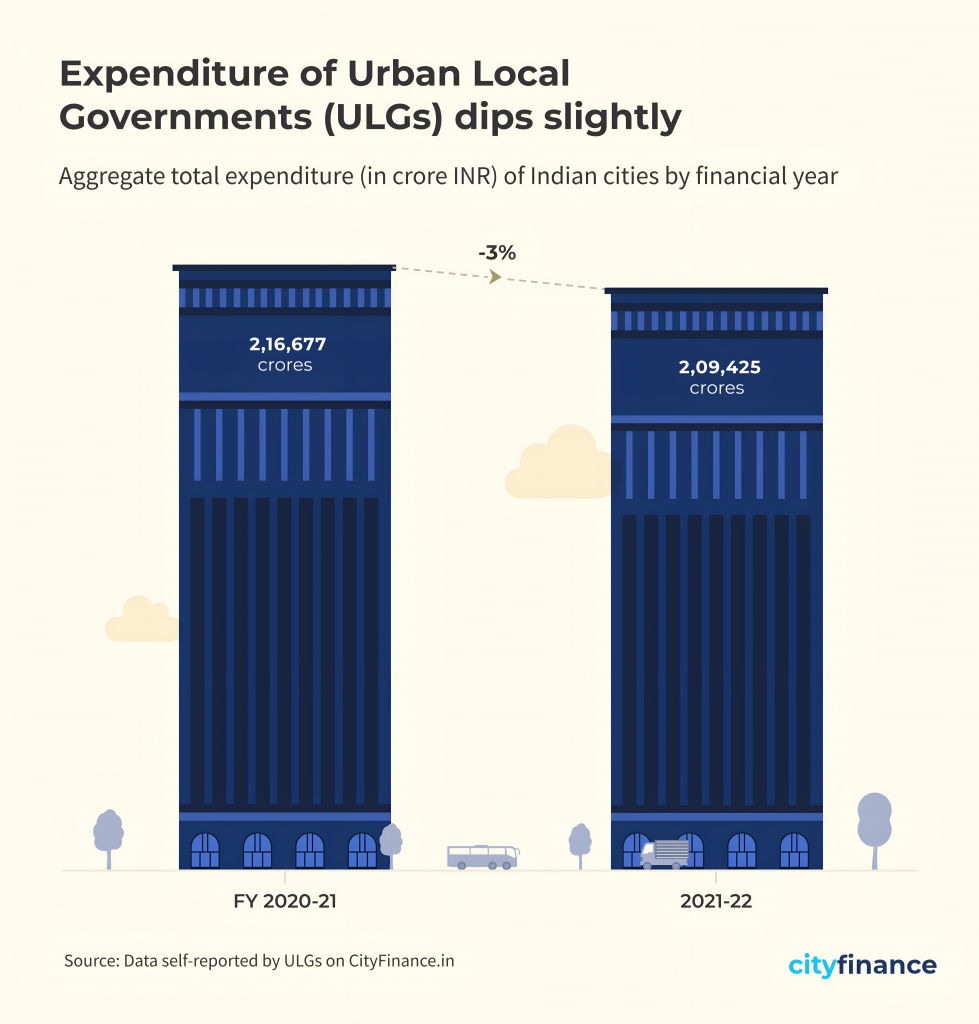
Data shows that total expenditure of ULGs declined from 2020-21 to 2021-22. This drop in expenditure requires detailed investigation to determine whether it stems from reduced developmental or capital spending, lower recovery-related expenditure post-pandemic, contraction in government programmes, or a combination of these factors.
To understand this expenditure trend, let us examine how this change is reflected in different population categories.
The Expenditure Divide: Unequal Fiscal Capacity across Cities
Looking at the chart, it is clear that expenditure patterns vary significantly across different city categories. While it is expected that larger cities would spend more, the disparity is stark. Large cities with populations above 4 million account for the lion’s share of urban spending while smaller cities demonstrate modest expenditure levels.
It is important to note that these cities differ significantly in population size, revenue composition, urban service priorities, and other characteristics. Therefore, analysing expenditure patterns requires a differentiated approach that accounts for the distinct contexts of different city categories.
Examining per-capita spending reveals an interesting picture with megacities spending several times more per urban resident than mid-sized and smaller ULGs. This divergent fiscal behaviour suggests structural inequalities in urban finance. We must ask whether these differences stem from variations in resource availability, administrative capacity, or the differentiated cost of delivery of services in a metropolis versus a small town.
Across India: The Geography of Urban Spending
Expenditure capacity also varies by geography. As seen above, when we look at a state-by-state comparison, Southern and Western states demonstrate strong fiscal performance. Northern states show mixed performance, with some states maintaining surpluses while others exhibit low levels of expenditure. North-eastern states reveal an interesting picture with varied fiscal capacities across the region.
From Spending to Service Delivery: The Way Forward
While India’s megacities lead in urban spending, we cannot yet determine whether higher spending translates into better urban outcomes, as we lack the data linkages to connect expenditure with service delivery outcomes.
What matters is allocation. The allocation patterns between revenue and capital expenditure require further study to understand if cities that channel more funds towards water supply, sanitation, mobility, and public spaces, achieve better service quality compared to cities whose spending is dominated by administrative costs. It is important to note that establishment expenses could also reflect investments in hiring personnel to improve urban service delivery, which may contribute positively to service outcomes. However, strengthening local capacity for planning, budgeting, and monitoring is essential to ensure that every additional rupee spent enhances liveability and equity for urban residents.
As India prepares for 600 million urban residents by 2036, understanding these expenditure gaps is critical. As we saw in our previous blog on a city’s total revenue, it is clear that a city’s income streams directly dictate its capacity to spend. Hence, it is important to look at the different revenue streams of a ULG.
Stay tuned for a deep dive into a city’s own revenue. To explore more and see your city’s expenditure in detail, head over to cityfinance.in.
Note: All data is sourced from the Annual Financial Statements submitted by the ULGs on the CityFinance platform. To ensure comprehensive representation and account for variations in data coverage and quality across cities, the figures presented are based on extrapolated financial data covering all 4,824 cities. Among these, 2,541 cities (approximately 60%) possess 3 years of contiguous data (2019–20 to 2021–22) in Cityfinance platform. Data from these cities have been systematically extrapolated using the ’per capita scaling methodology’ to reflect the financial performance of the complete set of 4,824 cities. Learn more about the extrapolation methodology here.