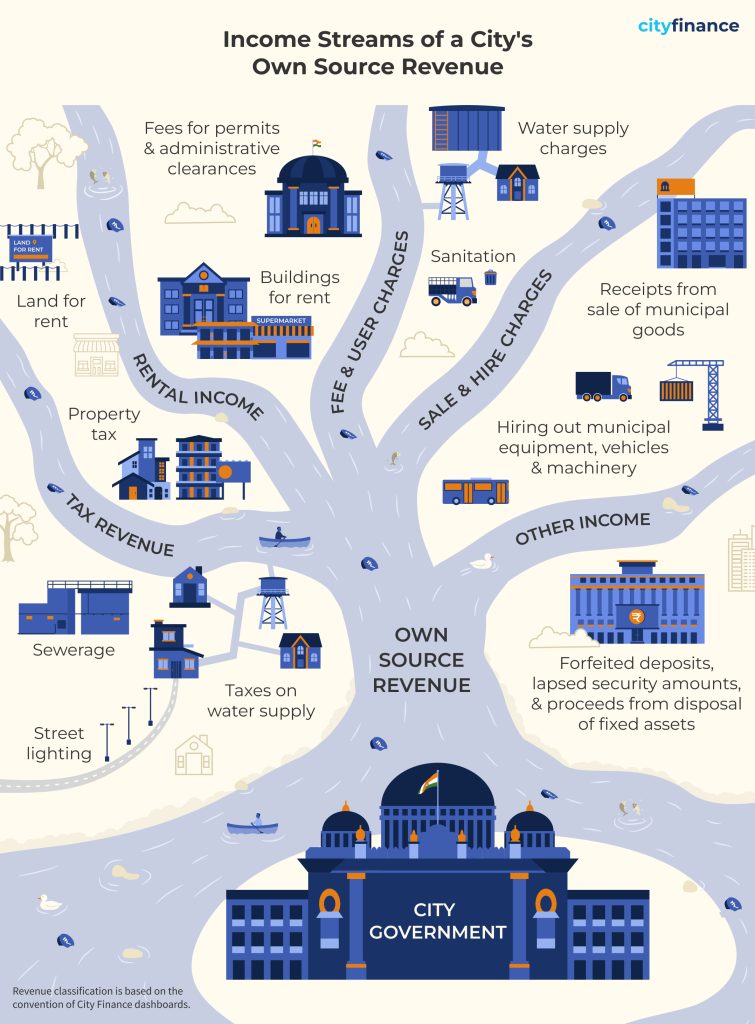
When was the last time you paid your city directly for something, not a tax, but a fee for a specific service or approval? If you can’t quite remember, you’re not alone. Most citizens interact with municipal fees, and user charges constantly yet rarely notice them as a distinct and surprisingly large source of city revenue.
In our previous blog, we broke down Own Source Revenue (OSR) into its building blocks and found that fees and user charges form its second-largest component nationally, accounting for an average of 32 per cent of the total. This blog post takes a closer look at that component: what fees and user charges consist of, and how their composition plays out across some of India’s largest cities.
What Counts as a Fee, What Counts as a Charge
A fee is a levy by ULGs for performing specific statutory and regulatory functions, while a user charge is a payment for the usage of a municipal service, often linked directly to the consumption or utilisation of that service. According to the National Municipal Accounts Manual (NMAM), fees include licensing fees, fees for grant of permit, fees for certificate or extract, regularisation fees, penalties and fines, entry fees, and other fees while user charges include empanelment and registration charges, development charges, service/administrative charges, and other charges.
Conceptually, user charges are meant to recover at least a portion of the operation and maintenance costs of municipal services such as water supply, sanitation, solid waste management, and parking. Fees, on the other hand, are intended to compensate ULGs for regulatory and administrative functions, including licensing, inspection, certification, and approvals. In practice, however, the distinction between the two is often blurred in municipal accounts.
An examination of fee and user charge revenues in India’s largest cities – Mumbai, Bengaluru, Chennai, Hyderabad, Kolkata, Surat, Ahmedabad, and Pune*, shows that these revenue streams function not only as instruments of service pricing, but also as a reflection of how cities govern and finance urban services.
Fees, User Charges, and the Wider OSR Picture
Zooming out to the full Own Source Revenue base, tax revenue emerges as the largest contributor in six of the eight cities, with fees and user charges forming the next most significant stream.
Two cities stand apart from this pattern. In Mumbai, OSR is shaped not only by taxes and fees and user charge revenue but also by a substantial share of other (miscellaneous) income. In Surat, fees and user charges surpass tax revenue altogether to become the single largest component of OSR, pointing to a comparatively stronger reliance on service and regulation-linked receipts.
An Even Divide: Fees vs. User Charges Across India’s Largest Cities
The data reveals an even divide across the eight cities. Mumbai, Surat, Ahmedabad and Pune derive a larger share of this revenue from user charges, while Hyderabad, Chennai, Bengaluru and Kolkata rely more on fees. This pattern suggests that the former group leans relatively more on service-linked revenue streams, while the latter mobilises a greater proportion of its income through regulatory and permission-based functions.
Same Categories, Different Priorities
Across cities, the composition of fees and user charges reflects the different functional pathways through which ULGs mobilise their Own Source Revenue.
| Major User Charges Streams | City | What This Reveals |
|---|---|---|
| Development Charges | Hyderabad, Bengaluru, Mumbai, Surat, Pune, and Ahmedabad | Strong reliance on urban planning approvals, land development processes, and infrastructure-related contributions. |
| User Charges | Bengaluru, Mumbai, Kolkata, and Surat | Sanitation, water services, health-related services, and other civic amenities form an important basis for recurring municipal income. |
| Service/Administrative Charges | Chennai | Revenue flowing from engineering oversight, supervisory roles and administrative processes rather than direct service consumption. |
| Major Fees | City | What This Reveals |
|---|---|---|
| Fees for Grant of Permits | Hyderabad, Chennai, Kolkata and Ahmedabad | Revenue generation through development control, construction approvals, and transport or logistics regulation. |
| Licensing Fee | Bengaluru and Pune | Revenues from market regulation and commercial activity permissions, linking fiscal flows to public health oversight and civic compliance mechanisms. |
| Regularisation Fees | Mumbai and Kolkata | Revenues arise from post-facto compliance and corrective planning measures. |
| Other Fees | Mumbai, Surat, and Ahmedabad | Reflecting property record administration (mutation and transfer charges), tax enforcement documentation (notice and warrant fees), utility service connections, and civic facility charges (advertisement, tuition, survey fees). |
Taken together, these patterns suggest that while some cities monetise growth and regulatory authority, others rely more strongly on service-linked revenue streams, illustrating the varied ways ULGs translate their functional responsibilities into Own Source Revenue.
Key Takeaways
The 74th Constitutional Amendment laid out a comprehensive framework for municipal fiscal empowerment, and the functions listed in the Twelfth Schedule potentially create multiple opportunities for fees and user charges. But constitutional empowerment alone does not guarantee fiscal outcomes. Translating that potential into actual own-revenue growth depends on state legislative action, administrative capacity for revenue administration, and clarity in how functional responsibilities are assigned across service areas.
As this analysis shows, fees and user charges are far from a monolithic revenue stream; their composition varies as much with how a city governs as with how it grows.
Stay tuned as we continue this series unpacking the building blocks of India’s municipal finances.
*Pune has been included as it is among India’s top cities in terms of population size and municipal financial volume. All the other cities in the analysis are cities with populations above 4 million.