Category: Featured

  • Paying for the Service: Unpacking Fees and User Charges in India’s Largest Cities 

    Paying for the Service: Unpacking Fees and User Charges in India’s Largest Cities 

    When was the last time you paid your city directly for something, not a tax, but a fee for a specific service or approval? If you can’t quite remember, you’re not alone. Most citizens interact with municipal fees, and user charges constantly yet rarely notice them as a distinct and surprisingly large source of city revenue. 

    In our previous blog, we broke down Own Source Revenue (OSR) into its building blocks and found that fees and user charges form its second-largest component nationally, accounting for an average of 32 per cent of the total. This blog post takes a closer look at that component: what fees and user charges consist of, and how their composition plays out across some of India’s largest cities. 

    What Counts as a Fee, What Counts as a Charge 

    A fee is a levy by ULGs for performing specific statutory and regulatory functions, while a user charge is a payment for the usage of a municipal service, often linked directly to the consumption or utilisation of that service. According to the National Municipal Accounts Manual (NMAM), fees include licensing fees, fees for grant of permit, fees for certificate or extract, regularisation fees, penalties and fines, entry fees, and other fees while user charges include empanelment and registration charges, development charges, service/administrative charges, and other charges.

    Conceptually, user charges are meant to recover at least a portion of the operation and maintenance costs of municipal services such as water supply, sanitation, solid waste management, and parking. Fees, on the other hand, are intended to compensate ULGs for regulatory and administrative functions, including licensing, inspection, certification, and approvals. In practice, however, the distinction between the two is often blurred in municipal accounts. 

    An examination of fee and user charge revenues in India’s largest cities – Mumbai, Bengaluru, Chennai, Hyderabad, Kolkata, Surat, Ahmedabad, and Pune*, shows that these revenue streams function not only as instruments of service pricing, but also as a reflection of how cities govern and finance urban services. 

    Fees, User Charges, and the Wider OSR Picture 

    Zooming out to the full Own Source Revenue base, tax revenue emerges as the largest contributor in six of the eight cities, with fees and user charges forming the next most significant stream. 

    Two cities stand apart from this pattern. In Mumbai, OSR is shaped not only by taxes and fees and user charge revenue but also by a substantial share of other (miscellaneous) income. In Surat, fees and user charges surpass tax revenue altogether to become the single largest component of OSR, pointing to a comparatively stronger reliance on service and regulation-linked receipts. 

    An Even Divide: Fees vs. User Charges Across India’s Largest Cities 

    The data reveals an even divide across the eight cities. Mumbai, Surat, Ahmedabad and Pune derive a larger share of this revenue from user charges, while Hyderabad, Chennai, Bengaluru and Kolkata rely more on fees. This pattern suggests that the former group leans relatively more on service-linked revenue streams, while the latter mobilises a greater proportion of its income through regulatory and permission-based functions. 

    Same Categories, Different Priorities

    Across cities, the composition of fees and user charges reflects the different functional pathways through which ULGs mobilise their Own Source Revenue. 

    Major User Charges StreamsCityWhat This Reveals
    Development Charges Hyderabad, Bengaluru, Mumbai, Surat, Pune, and AhmedabadStrong reliance on urban planning approvals, land development processes, and infrastructure-related contributions. 
    User ChargesBengaluru, Mumbai, Kolkata, and SuratSanitation, water services, health-related services, and other civic amenities form an important basis for recurring municipal income.
    Service/Administrative ChargesChennaiRevenue flowing from engineering oversight, supervisory roles and administrative processes rather than direct service consumption. 
    Major FeesCityWhat This Reveals
    Fees for Grant of Permits Hyderabad, Chennai, Kolkata and AhmedabadRevenue generation through development control, construction approvals, and transport or logistics regulation.
    Licensing Fee Bengaluru and Pune Revenues from market regulation and commercial activity permissions, linking fiscal flows to public health oversight and civic compliance mechanisms. 
    Regularisation Fees Mumbai and KolkataRevenues arise from post-facto compliance and corrective planning measures.
    Other FeesMumbai, Surat, and Ahmedabad Reflecting property record administration (mutation and transfer charges), tax enforcement documentation (notice and warrant fees), utility service connections, and civic facility charges (advertisement, tuition, survey fees).

    Taken together, these patterns suggest that while some cities monetise growth and regulatory authority, others rely more strongly on service-linked revenue streams, illustrating the varied ways ULGs translate their functional responsibilities into Own Source Revenue. 

    Key Takeaways 

    The 74th Constitutional Amendment laid out a comprehensive framework for municipal fiscal empowerment, and the functions listed in the Twelfth Schedule potentially create multiple opportunities for fees and user charges. But constitutional empowerment alone does not guarantee fiscal outcomes. Translating that potential into actual own-revenue growth depends on state legislative action, administrative capacity for revenue administration, and clarity in how functional responsibilities are assigned across service areas. 

    As this analysis shows, fees and user charges are far from a monolithic revenue stream; their composition varies as much with how a city governs as with how it grows.

    Stay tuned as we continue this series unpacking the building blocks of India’s municipal finances. 

    *Pune has been included as it is among India’s top cities in terms of population size and municipal financial volume. All the other cities in the analysis are cities with populations above 4 million.

    Note: All data is sourced from the Annual Financial Statements submitted by the ULGs on the CityFinance platform. To ensure comprehensive representation and account for variations in data coverage and quality across cities, the figures presented are based on extrapolated financial data covering all 4,824 cities. Among these, 2,541 cities (approximately 60%) possess 3 years of contiguous data (2019–20 to 2021–22) in Cityfinance platform. Data from these cities have been systematically extrapolated using the ’per capita scaling methodology’ to reflect the financial performance of the complete set of 4,824 cities. Learn more about the extrapolation methodology here.  

  • Inside the Revenue Mix: What Makes Up a City’s Own Source Revenue? 

    Inside the Revenue Mix: What Makes Up a City’s Own Source Revenue? 

    A city’s fiscal autonomy is only as strong as the revenue it generates on its own and, as our last blog post showed, that autonomy is far from evenly distributed. But what exactly makes up that revenue?

    In our previous blog post, we explored how Own Source Revenue (OSR) is generated across cities of different sizes and states. OSR is not a single revenue stream; it is a combination of different revenue components that Urban Local Governments (ULGs) generate through their taxation powers, service delivery functions and assets. Each of these components contributes differently, shaping the overall structure of municipal own revenue.

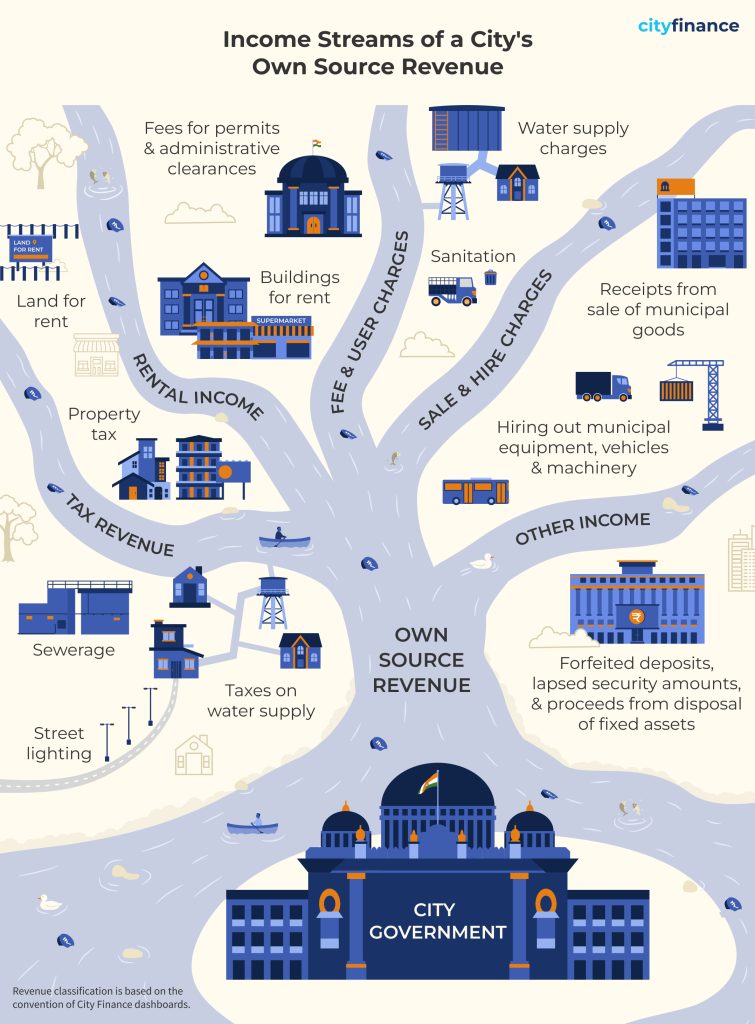
    At its core, OSR comprises two broad categories: tax and non-tax revenue. Tax revenue is dominated by property tax, alongside levies on water supply, sewerage, conservancy, street lighting, education, and other municipal services. 

    Non-tax revenue is more diverse and includes fees and user charges for services such as water supply, sanitation, and solid waste management, as well as payments for licenses, permits, and regulatory approvals. Other important components include sale and hire charges, generated from the sale of municipal goods and the hiring of municipal equipment or vehicles, and rental income from leasing municipal assets such as shops, markets, community halls, and land. 

    OSR also includes a residual category termed ‘other income,’ comprising receipts such as forfeited deposits, employee recoveries, disposal of assets, and various accounting adjustments. Unlike taxes and user charges, these receipts are often irregular and unpredictable. 

    The average composition of Own Source Revenue of Indian ULGs across FY 2019–20 to FY 2021–22 highlights the continued dominance of tax revenue, which accounts for half of total OSR. Fees and user charges constitute the second-largest component at 32 per cent, underscoring the importance of service-linked non-tax revenues in municipal finances. Other income contributes 14 per cent, while rental income (3 per cent) and sale and hire charges (1 per cent) together form a relatively small share. Overall, the revenue mix suggests that municipal finances remain anchored in taxation, with non-tax sources, particularly fees and user charges, playing an important, complementary role in strengthening local revenue generation. 

    From Small Towns to Megacities: A Telling Revenue Picture

    FY 2021–22 data shows that tax revenue remains the primary source of OSR for most Indian cities. The notable exception is 4-million-plus cities (4M+ cities), where fees and user charges account for the largest share (47 per cent). 4M+ cities and cities with population less than 100K show a relatively higher share of ’other income’. In contrast, sale and hire charges remain marginal across all city categories. 

    ULGs of a majority of Indian states exhibit limited diversification in their OSR structures, with heavy reliance on tax revenue and fees and user charges. In 12 out of 24 states analysed, these two sources together account for more than 75 per cent of total OSR. Rental income remains a minor contributor in most states, averaging around 15 per cent across the sample. Sale and hire charges are negligible almost universally, rarely exceeding 10 per cent. 

     Key Takeaways 

    The composition of a city’s Own Source Revenue tells a story not just of how much OSR it raises, but of how it raises it and how sustainably it can do so. Across Indian states, the picture is one of limited diversification, a heavy reliance on tax revenue and fees and user charges, with rental income and other receipts remaining largely untapped.  

    Improving Own Source Revenue is not just about diversifying revenue streams. It demands strengthening collection efficiency within existing sources, rationalising fee structures, and reducing dependence on a narrow own revenue base. Achieving this, however, demands skills and capacities that many ULGs, particularly smaller ones, currently lack. Hence, strengthening local capacity is an equally important priority.  As cities face growing expenditure pressures, building a more resilient and self-sufficient municipal finance system is not just a fiscal imperative, it is foundational to delivering better urban services and stronger local governance. 

    Stay tuned for a closer look at the key components of Own Source Revenue of cities.  

    Note: All data is sourced from the Annual Financial Statements submitted by the ULGs on the CityFinance platform. To ensure comprehensive representation and account for variations in data coverage and quality across cities, the figures presented are based on extrapolated financial data covering all 4,824 cities. Among these, 2,541 cities (approximately 60%) possess 3 years of contiguous data (2019–20 to 2021–22) in Cityfinance platform. Data from these cities have been systematically extrapolated using the ’per capita scaling methodology’ to reflect the financial performance of the complete set of 4,824 cities. Learn more about the extrapolation methodology here.  

  • Exploring the Fiscal Autonomy of Cities with CityFinance.in: A Beginner’s Guide

    Exploring the Fiscal Autonomy of Cities with CityFinance.in: A Beginner’s Guide

    This Fiscal Autonomy Primer marks the third edition in a multi-part series on the financial data of cities hosted on CityFinance.in. Each edition in the series will spotlight one key fiscal indicator, offering a focused analysis to demonstrate the different kinds of insights that can be drawn from the data and how they inform a deeper understanding of urban finance. This initiative aims to foster greater understanding and engagement with the financial data of Indian cities, with the broader goal of enabling deeper analysis and further research in this critical area. In this edition, we will be looking at a crucial parameter that determines a city’s financial stability: Own Source Revenue.

    What if India’s cities could only spend what they earned? For most Urban Local Governments (ULGs), this would mean dramatic cuts to essential services, revealing a dependence on state and central transfers rather than self-generated revenue. A deeper examination of the Own Source Revenue (OSR) patterns of cities is therefore crucial to enhance urban financial sustainability across India.

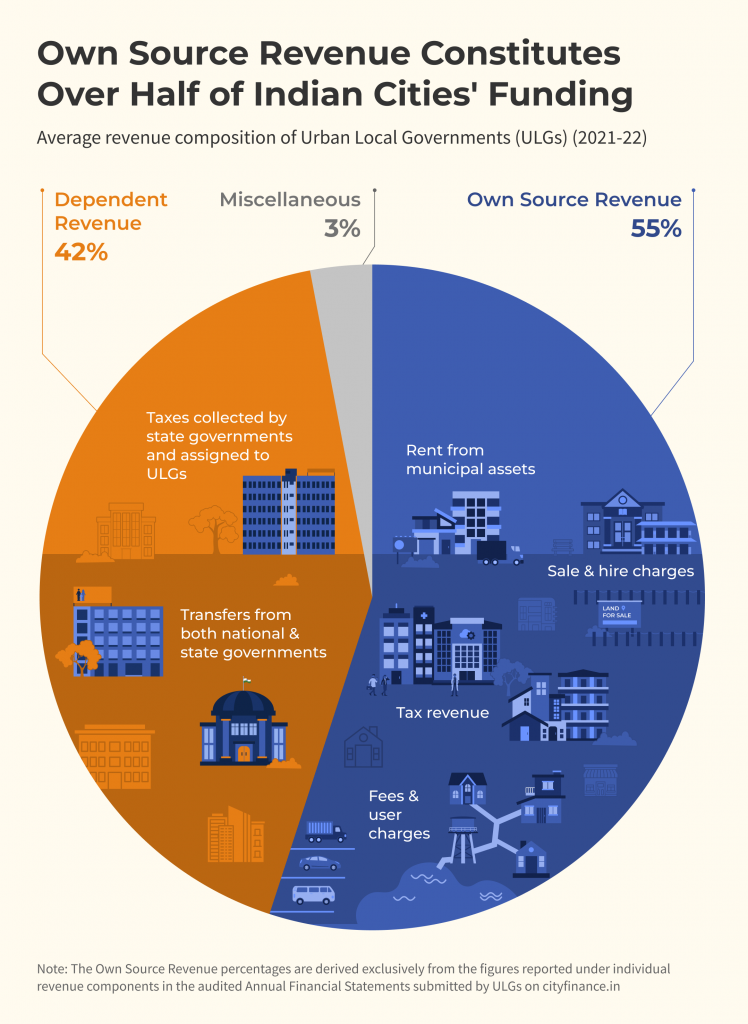
    Own Source Revenue refers to the income that ULGs generate independently through their own taxation powers, service and other charges. It comprises tax revenue, revenue from fees and user charges, sale and hire charges, rental income from municipal properties, and other sources of income that is not coming from central or state governments.

    The data reveals that Own Source Revenue contributed around half of aggregate total revenue of ULGs in FY 2021-22. While this trend appears encouraging at the aggregate level, a closer look at OSR composition across cities of varying sizes is warranted. 

    A clear pattern emerges: larger cities consistently outperform smaller ones in generating their own revenue.

    Geography of Fiscal Self-Reliance 

    The geographic variation in OSR performance across cities of different sizes and states suggests that outcomes are shaped by a confluence of factors, including levels of urbanisation, economic base, state-level fiscal frameworks, and administrative capacity. However, strong OSR figures must be interrogated further: the critical question is whether these own revenue gains are resulting in measurably better services for urban residents.

    Beyond Taxes, Fees and User Charges: Improving Fiscal Autonomy

    Improving fiscal autonomy requires more than just strengthening tax collection and rationalising fees and user charges. ULGs can meaningfully expand their fiscal autonomy through municipal bonds and public-private partnerships. 

    A municipal bond is a marketable debt instrument where a ULG borrows funds from investors for a defined period at a fixed or variable interest rate. The funds raised can be used for infrastructure development. This allows ULGs to access money immediately while paying it back through future revenues, helping them attract long-term capital, build credit profiles, and bring greater accountability and transparency to citizens.  

    However, municipal bonds remain severely underutilised – only 22 ULGs have issued bonds since the Securities and Exchange Board of India (SEBI) released its guidelines in 2015. The promise of municipal bonds can only be realised if ULGs are genuinely equipped to use them. This calls for enhanced fiscal discipline, robust financial processes, stronger institutional capacity at the local level, and more structured engagement with private partners through Public-Private Partnerships (PPPs). Without these enabling conditions, municipal bonds will remain an instrument available on paper but out of reach in practice for the vast majority of India’s cities.

    Bridging the Gap: The Road Ahead

    The OSR patterns and the extent of use of instruments like municipal bonds collectively point to an urban fiscal landscape where the capacity for self-finance is heavily skewed toward larger cities with better capacities, leaving smaller ULGs disproportionately dependent on grants and transfers. Bridging this gap will require targeted interventions, modernising tax systems, rationalising fees and user charges, and building administrative capacity in smaller cities. Without deliberate and sustained reforms to strengthen municipal revenue systems at the grassroots, the promise of genuine urban financial autonomy will remain concentrated at the top, widening, rather than narrowing, the divide between India’s metro giants and its smaller cities.

    Stay tuned for a deeper look into Own Source Revenue of cities.

    Note: All data is sourced from the Annual Financial Statements submitted by the ULGs on the CityFinance platform. To ensure comprehensive representation and account for variations in data coverage and quality across cities, the figures presented are based on extrapolated financial data covering all 4,824 cities. Among these, 2,541 cities (approximately 60%) possess 3 years of contiguous data (2019–20 to 2021–22) in Cityfinance platform. Data from these cities have been systematically extrapolated using the ’per capita scaling methodology’ to reflect the financial performance of the complete set of 4,824 cities. Learn more about the extrapolation methodology here.

  • Unpacking Urban Revenue Composition 

    Unpacking Urban Revenue Composition 

    In our previous blog on total revenue of Indian cities, we explored how total revenues vary dramatically across Indian cities, with resources concentrated in major metropolitan areas. But these total revenue figures reveal only a part of the story.  

    Understanding where that revenue comes from is equally important. The composition of a city’s revenue, how much it raises on its own versus how much it receives from higher tiers of government, speaks directly to its fiscal autonomy, financial resilience, and capacity for self-determined growth. Examining revenue composition thus moves the conversation beyond how much cities earn to how they earn it.

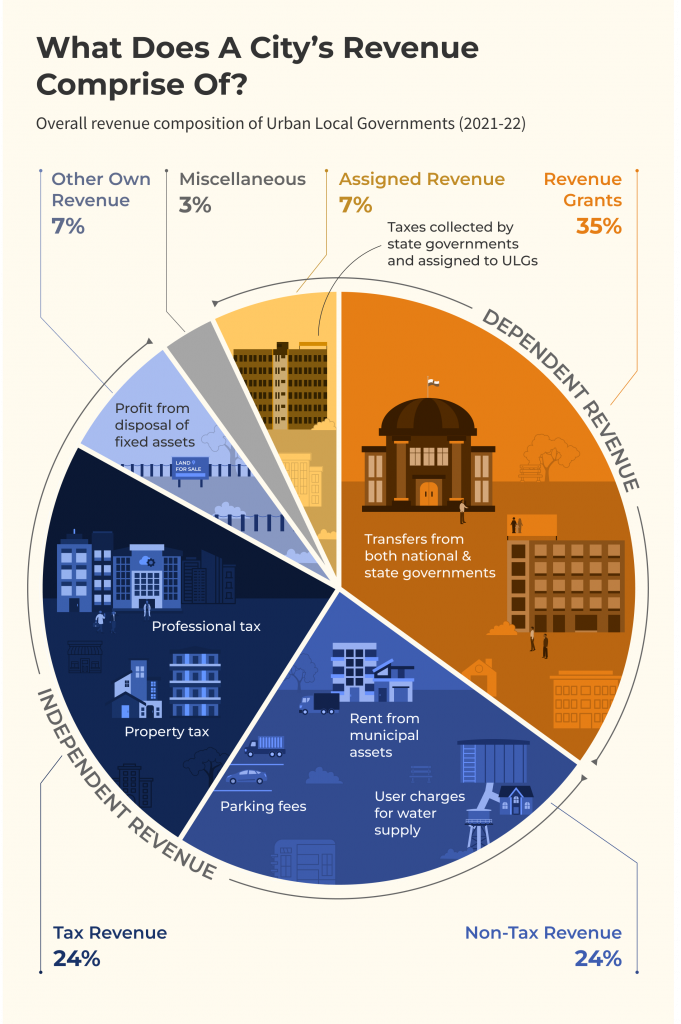
    As shown in the figure above, at the national level, the composition of municipal revenues exhibits a substantial share of grant revenue across ULGs. However, when we look at the graph below, we can see that this share is comparatively lower for million-plus cities. CityFinance data shows that larger ULGs, particularly million-plus cities, demonstrate a stronger own-source revenue base, supported by both tax and non-tax revenues, relative to smaller cities. 

    Although million-plus cities receive significant volumes of grants, these constitute a smaller proportion of their total revenue when compared to smaller ULGs. This reflects the larger revenue base of metropolitan cities, where tax and non-tax revenues contribute a greater share to overall municipal finances. 

    Notably, 4M+ cities show a relatively higher share of non-tax revenue within their revenue. This indicates a more diversified revenue composition with contributions from user charges, fees, rentals, and other service-related income streams alongside tax revenue. In contrast, smaller ULGs exhibit a relatively higher dependence on revenue grants within their overall revenue structure. 

    Overall, the data highlights variation in revenue composition across city size categories, reflecting differences in revenue structure and scale across urban India. 

    When compared with the national profile, state-wise regional variation becomes much more evident for FY 2021-22. 

    Northern states such as Uttar Pradesh (80% grants), Uttarakhand (84%), and Bihar (67%) show grant shares well above the national aggregate composition, with relatively lower tax and non-tax contributions. In contrast, southern states display a different composition: Telangana records 48% tax revenue and Andhra Pradesh 42% tax revenue, while Tamil Nadu shows a more balanced mix with 29% tax revenue and 34% grants. Gujarat and Maharashtra also exhibit less dependence on grants when compared to national aggregate composition.  

    Overall, the comparison reflects regional differences in revenue structure relative to the national composition, highlighting variation across India’s urban fiscal landscape.

    The Way Forward

    The analysis underscores that revenue profile of cities in India cannot be understood through aggregate revenue figures alone. A deeper look at revenue composition reveals important distinctions. While the proportion of intergovernmental grants in revenue composition of smaller cities remains higher, larger cities continue to receive higher per capita grants. The findings suggest that million-plus cities show higher collection of own-source revenue. Assigned revenue on the other hand decreased consistently which is a trend that warrants closer examination. The variations across states further reinforce that fiscal outcomes are influenced by governance structures, devolution frameworks and accounting practices.  

    Moving beyond aggregate figures to examine how city revenues are composed will offer a far more comprehensive understanding of where Indian cities stand fiscally and what it will take to strengthen their financial foundations. 

    In our next blog, we turn to Own Source Revenue performance across city categories and states and what it reveals about the fiscal health of India’s urban local governments. Stay tuned. 

    Note: All data is sourced from the Annual Financial Statements submitted by the ULGs on the CityFinance platform. To ensure comprehensive representation and account for variations in data coverage and quality across cities, the figures presented are based on extrapolated financial data covering all 4,824 cities. Among these, 2,541 cities (approximately 60%) possess 3 years of contiguous data (2019–20 to 2021–22) in Cityfinance platform. Data from these cities have been systematically extrapolated using the ’per capita scaling methodology’ to reflect the financial performance of the complete set of 4,824 cities. Learn more about the extrapolation methodology here.

  • Exploring City Expenditures with CityFinance.in: A Beginner’s Guide 

    Exploring City Expenditures with CityFinance.in: A Beginner’s Guide 

    This Total Expenditure Primer marks the second edition in a multi-part series on the city financial data hosted on CityFinance.in. Each edition in the series will spotlight one key fiscal indicator, offering a focused analysis to demonstrate the different kinds of insights that can be drawn from the data and how they inform a deeper understanding of urban finance. This initiative aims to foster greater understanding and engagement with the financial data of Indian cities, with the broader goal of enabling deeper analysis and further research in this critical area. Here we will be dealing with a crucial parameter that determines a city’s financial stability: Total Expenditure.

    What is a City’s Total Expenditure?  

    Urban infrastructure and services, from street lighting and water supply to road maintenance, are tangible results of a city’s expenditure at work. Understanding how much cities spend, how these funds are allocated, and why significant variations exist across urban centres is essential to evaluating the state of India’s urban governance. 

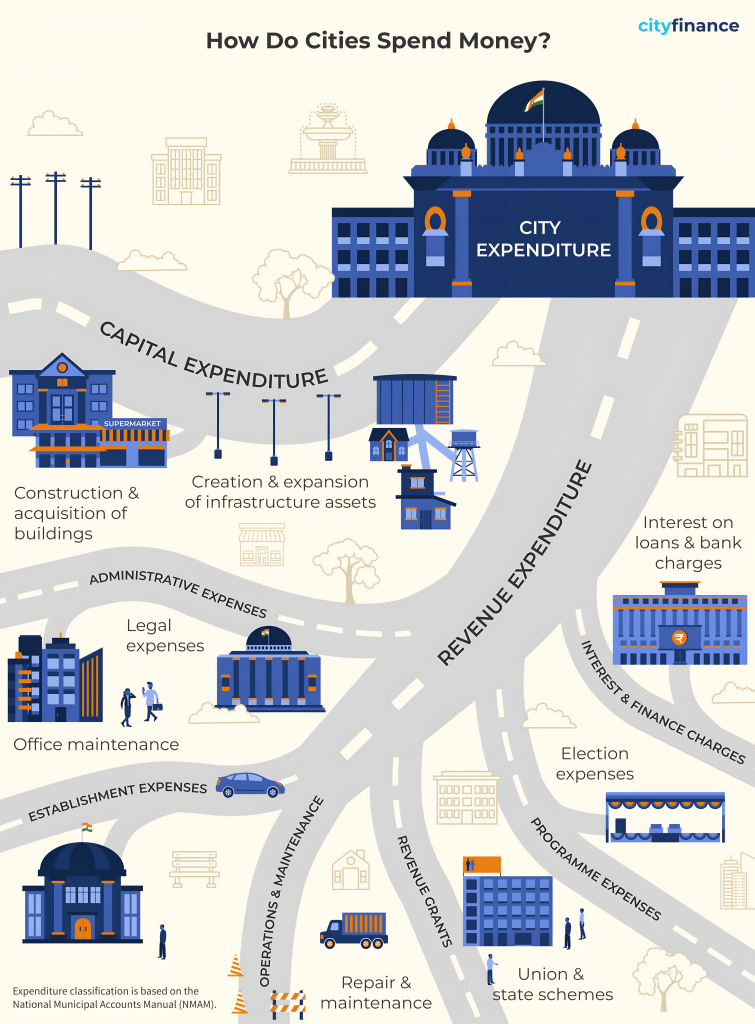
    At its simplest, Total Expenditure represents the complete amount of money spent by an Urban Local Government (ULG) during a financial year. It comprises two main components:  

    • Revenue Expenditure covers the day-to-day operational costs necessary to keep urban services running smoothly.  
    • Capital Expenditure refers to investments in creating or upgrading long-term infrastructure and assets.  

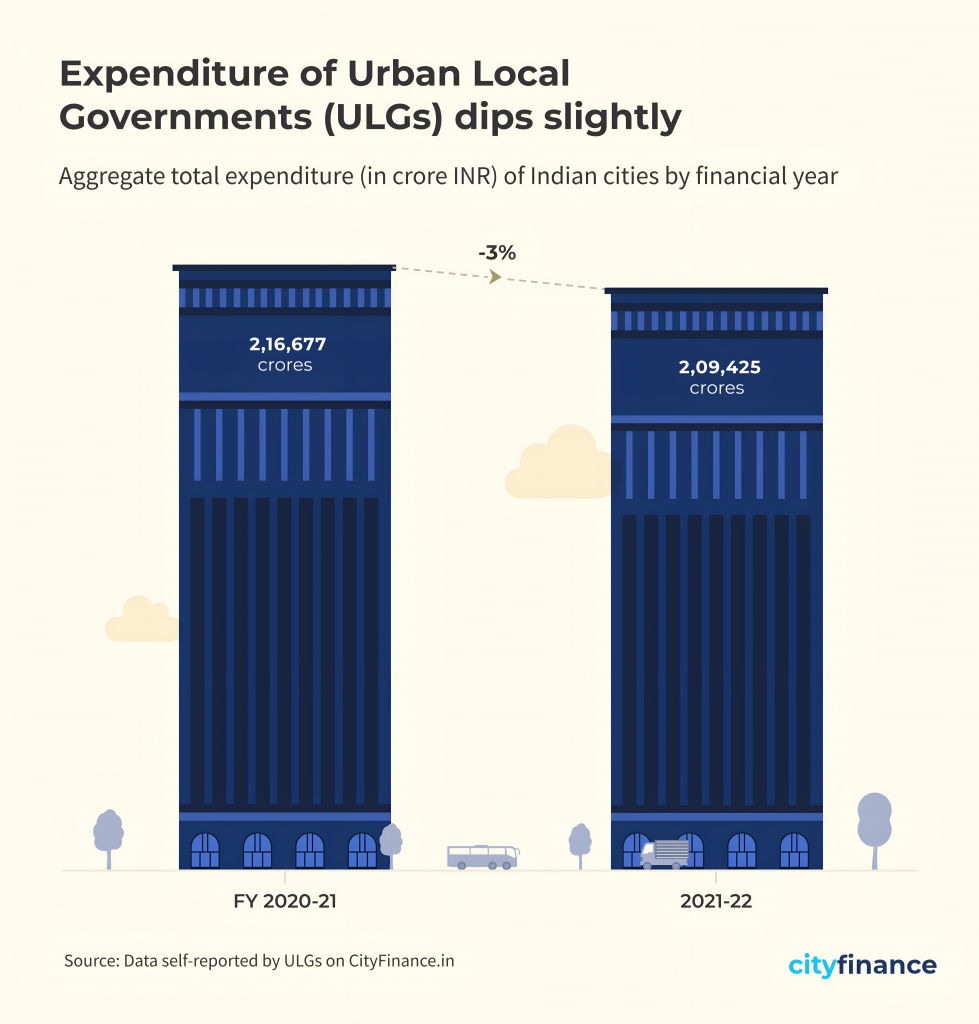
    ULG Expenditure Trends: A Decline in Spending (2020-2022) 

    Data shows that total expenditure of ULGs declined from 2020-21 to 2021-22. This drop in expenditure requires detailed investigation to determine whether it stems from reduced developmental or capital spending, lower recovery-related expenditure post-pandemic, contraction in government programmes, or a combination of these factors.  

    To understand this expenditure trend, let us examine how this change is  reflected in different population categories.  

    The Expenditure Divide: Unequal Fiscal Capacity across Cities

    Looking at the chart, it is clear that expenditure patterns vary significantly across different city categories. While it is expected that larger cities would spend more, the disparity is stark. Large cities with populations above 4 million account for the lion’s share of urban spending while smaller cities demonstrate modest expenditure levels.  

    It is important to note that these cities differ significantly in population size, revenue composition, urban service priorities, and other characteristics. Therefore, analysing expenditure patterns requires a differentiated approach that accounts for the distinct contexts of different city categories. 

    Examining per-capita spending reveals an interesting picture with megacities spending several times more per urban resident than mid-sized and smaller ULGs. This divergent fiscal behaviour suggests structural inequalities in urban finance. We must ask whether these differences stem from variations in resource availability, administrative capacity, or the differentiated cost of delivery of services in a metropolis versus a small town.  

    Across India: The Geography of Urban Spending 

    Expenditure capacity also varies by geography. As seen above, when we look at a state-by-state comparison, Southern and Western states demonstrate strong fiscal performance. Northern states show mixed performance, with some states maintaining surpluses while others exhibit low levels of expenditure. North-eastern states reveal an interesting picture with varied fiscal capacities across the region. 

    From Spending to Service Delivery: The Way Forward 

    While India’s megacities lead in urban spending, we cannot yet determine whether higher spending translates into better urban outcomes, as we lack the data linkages to connect expenditure with service delivery outcomes.  

    What matters is allocation. The allocation patterns between revenue and capital expenditure require further study to understand if cities that channel more funds towards water supply, sanitation, mobility, and public spaces, achieve better service quality compared to cities whose spending is dominated by administrative costs. It is important to note that establishment expenses could also reflect investments in hiring personnel to improve urban service delivery, which may contribute positively to service outcomes. However, strengthening local capacity for planning, budgeting, and monitoring is essential to ensure that every additional rupee spent enhances liveability and equity for urban residents.  

    As India prepares for 600 million urban residents by 2036, understanding these expenditure gaps is critical. As we saw in our previous blog on a city’s total revenue, it is clear that a city’s income streams directly dictate its capacity to spend. Hence, it is important to look at the different revenue streams of a ULG.  

    Stay tuned for a deep dive into a city’s own revenue. To explore more and see your city’s expenditure in detail, head over to cityfinance.in.

    Note: All data is sourced from the Annual Financial Statements submitted by the ULGs on the CityFinance platform. To ensure comprehensive representation and account for variations in data coverage and quality across cities, the figures presented are based on extrapolated financial data covering all 4,824 cities. Among these, 2,541 cities (approximately 60%) possess 3 years of contiguous data (2019–20 to 2021–22) in Cityfinance platform. Data from these cities have been systematically extrapolated using the ’per capita scaling methodology’ to reflect the financial performance of the complete set of 4,824 cities. Learn more about the extrapolation methodology here.


  • Exploring City Revenues: A Beginner’s Guide with CityFinance.in

    Exploring City Revenues: A Beginner’s Guide with CityFinance.in

    This Total Revenue Primer marks the first edition in a multi-part series on the financial data of cities hosted on CityFinance.in. Each edition in the series will spotlight one key fiscal indicator, offering a focused analysis to demonstrate the different kinds of insights that can be drawn from the data and how they inform a deeper understanding of urban finance. This initiative aims to foster greater understanding and engagement with financial data of Indian cities, enabling deeper analysis and research in this critical area. 

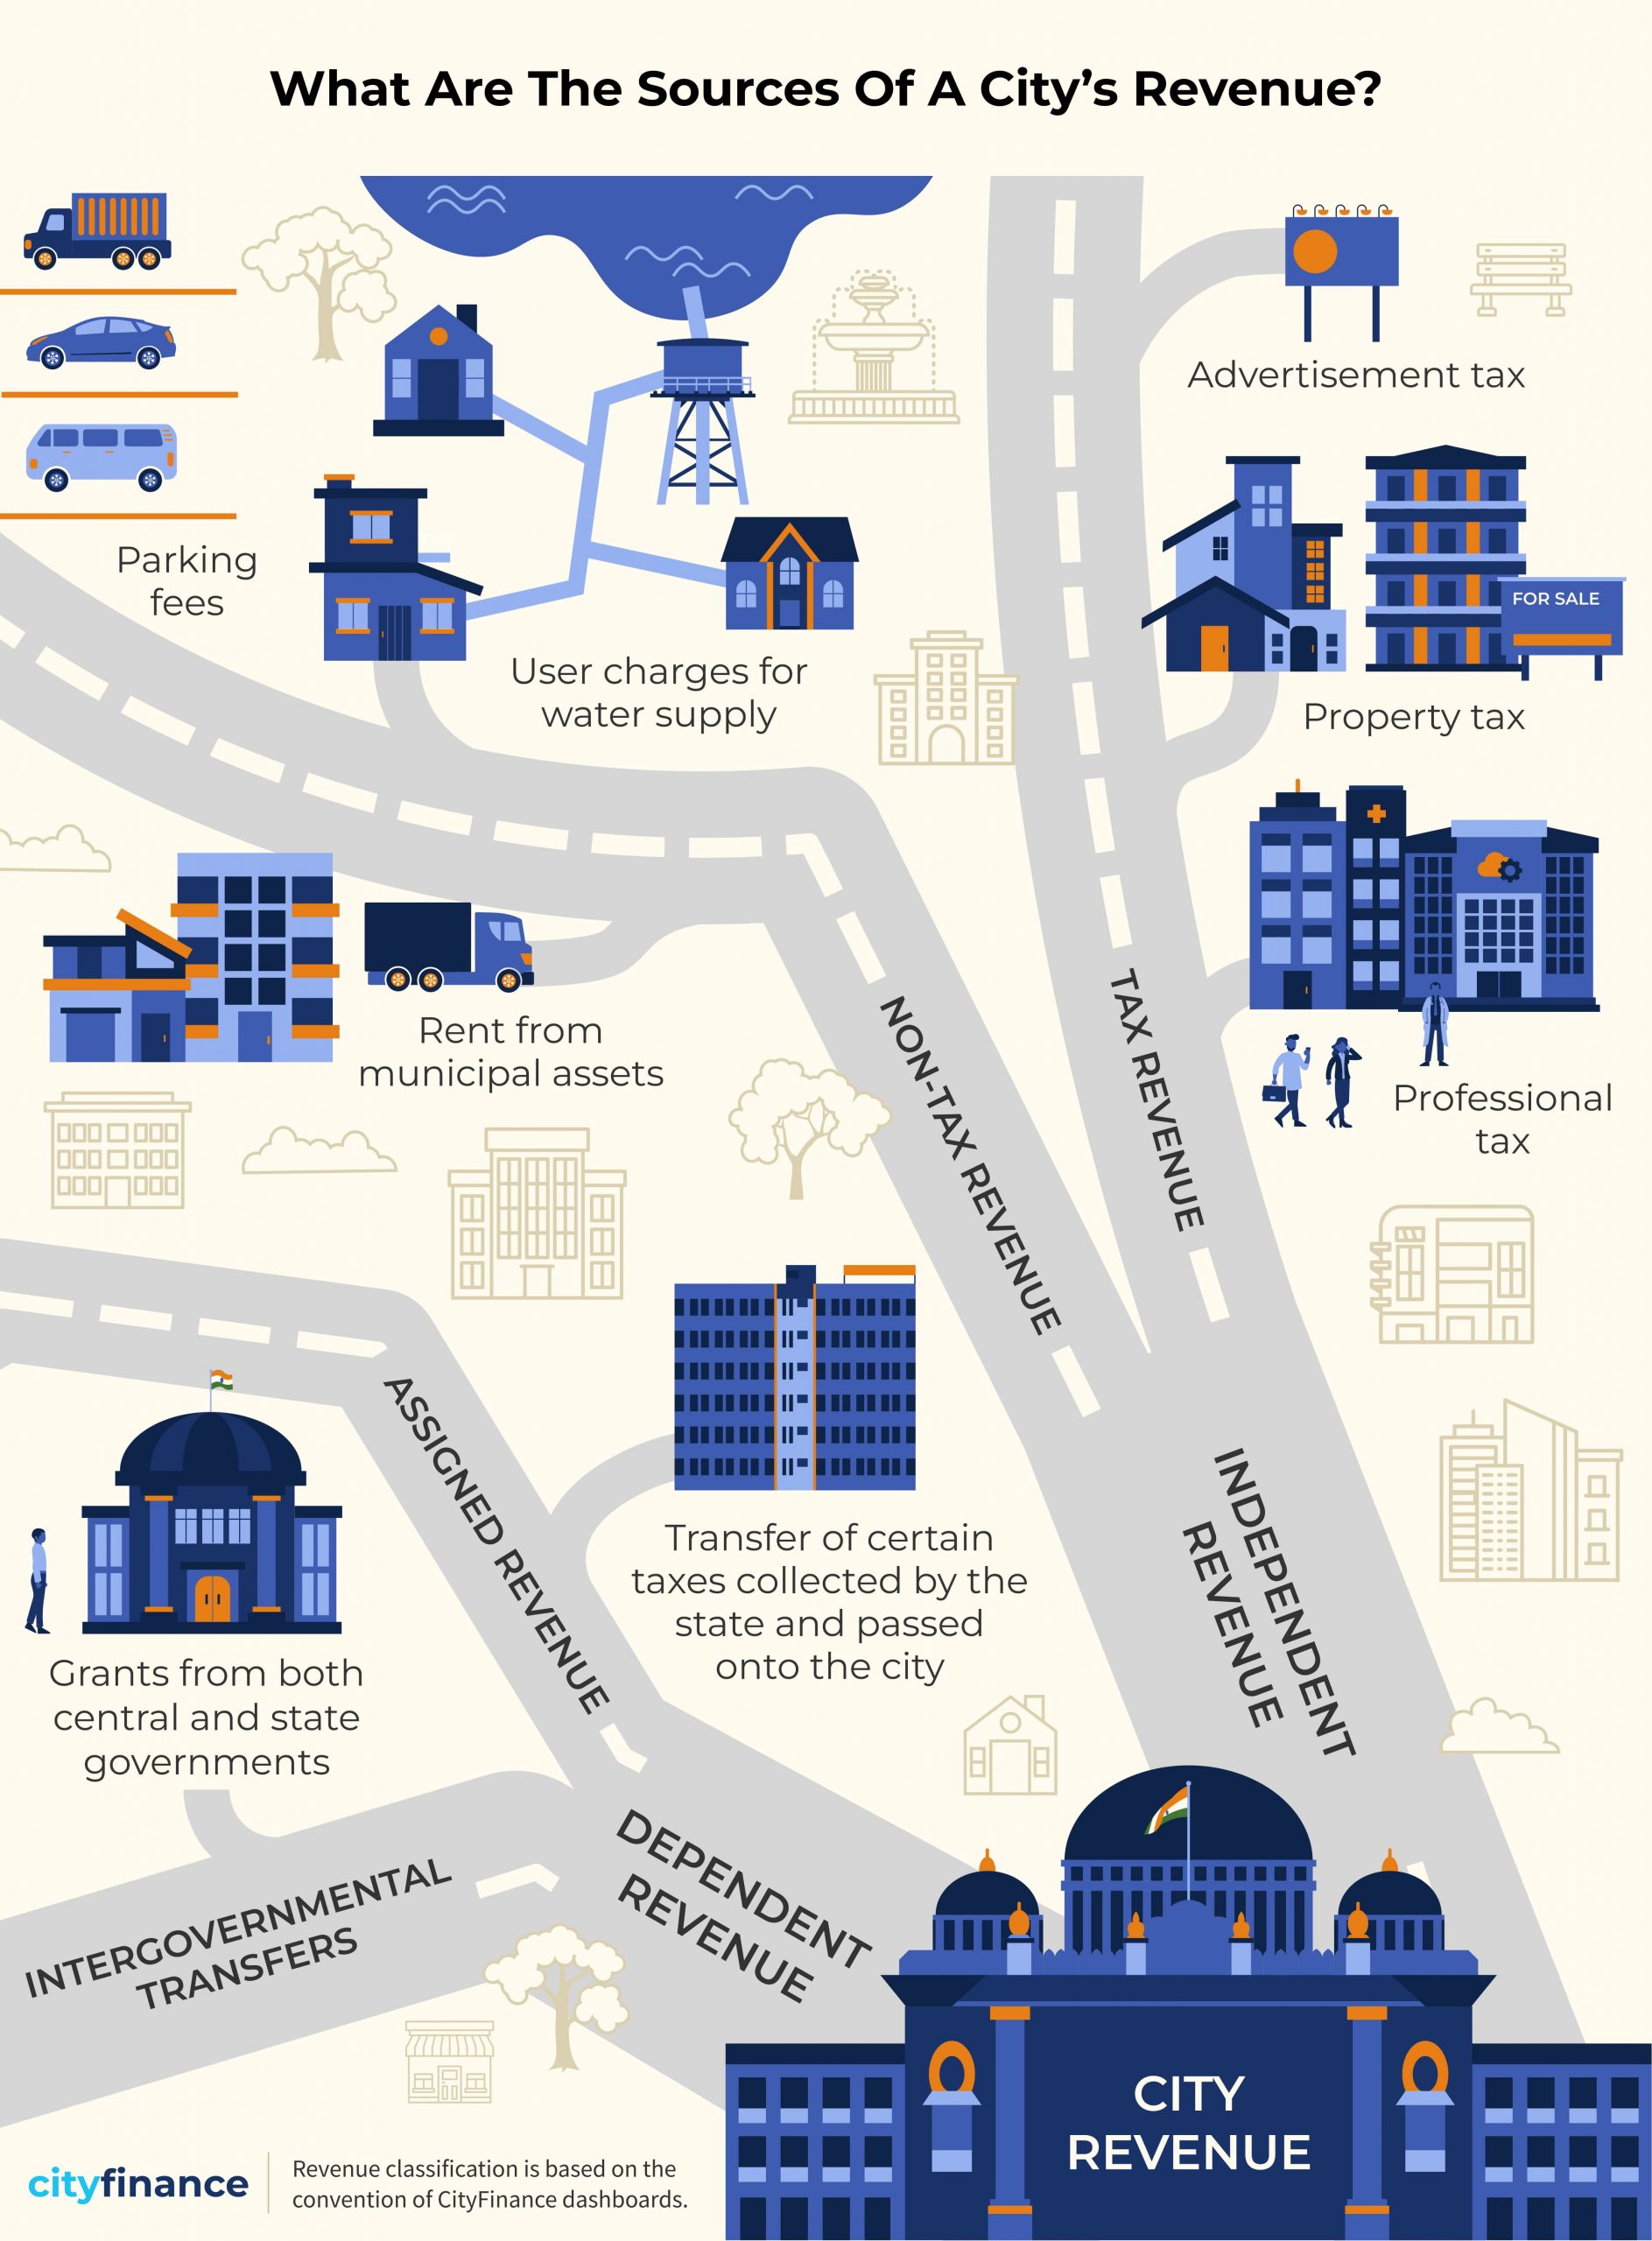
    Total revenue refers to the aggregate income a city receives from all sources. Major sources of a city’s revenue include tax revenue, non-tax revenue, assigned revenues, and intergovernmental grants from both state and central governments.

    Together, these streams form the financial backbone that supports a city’s operations and development initiatives. 


    Rising Revenues, Widening Revenue Gaps 

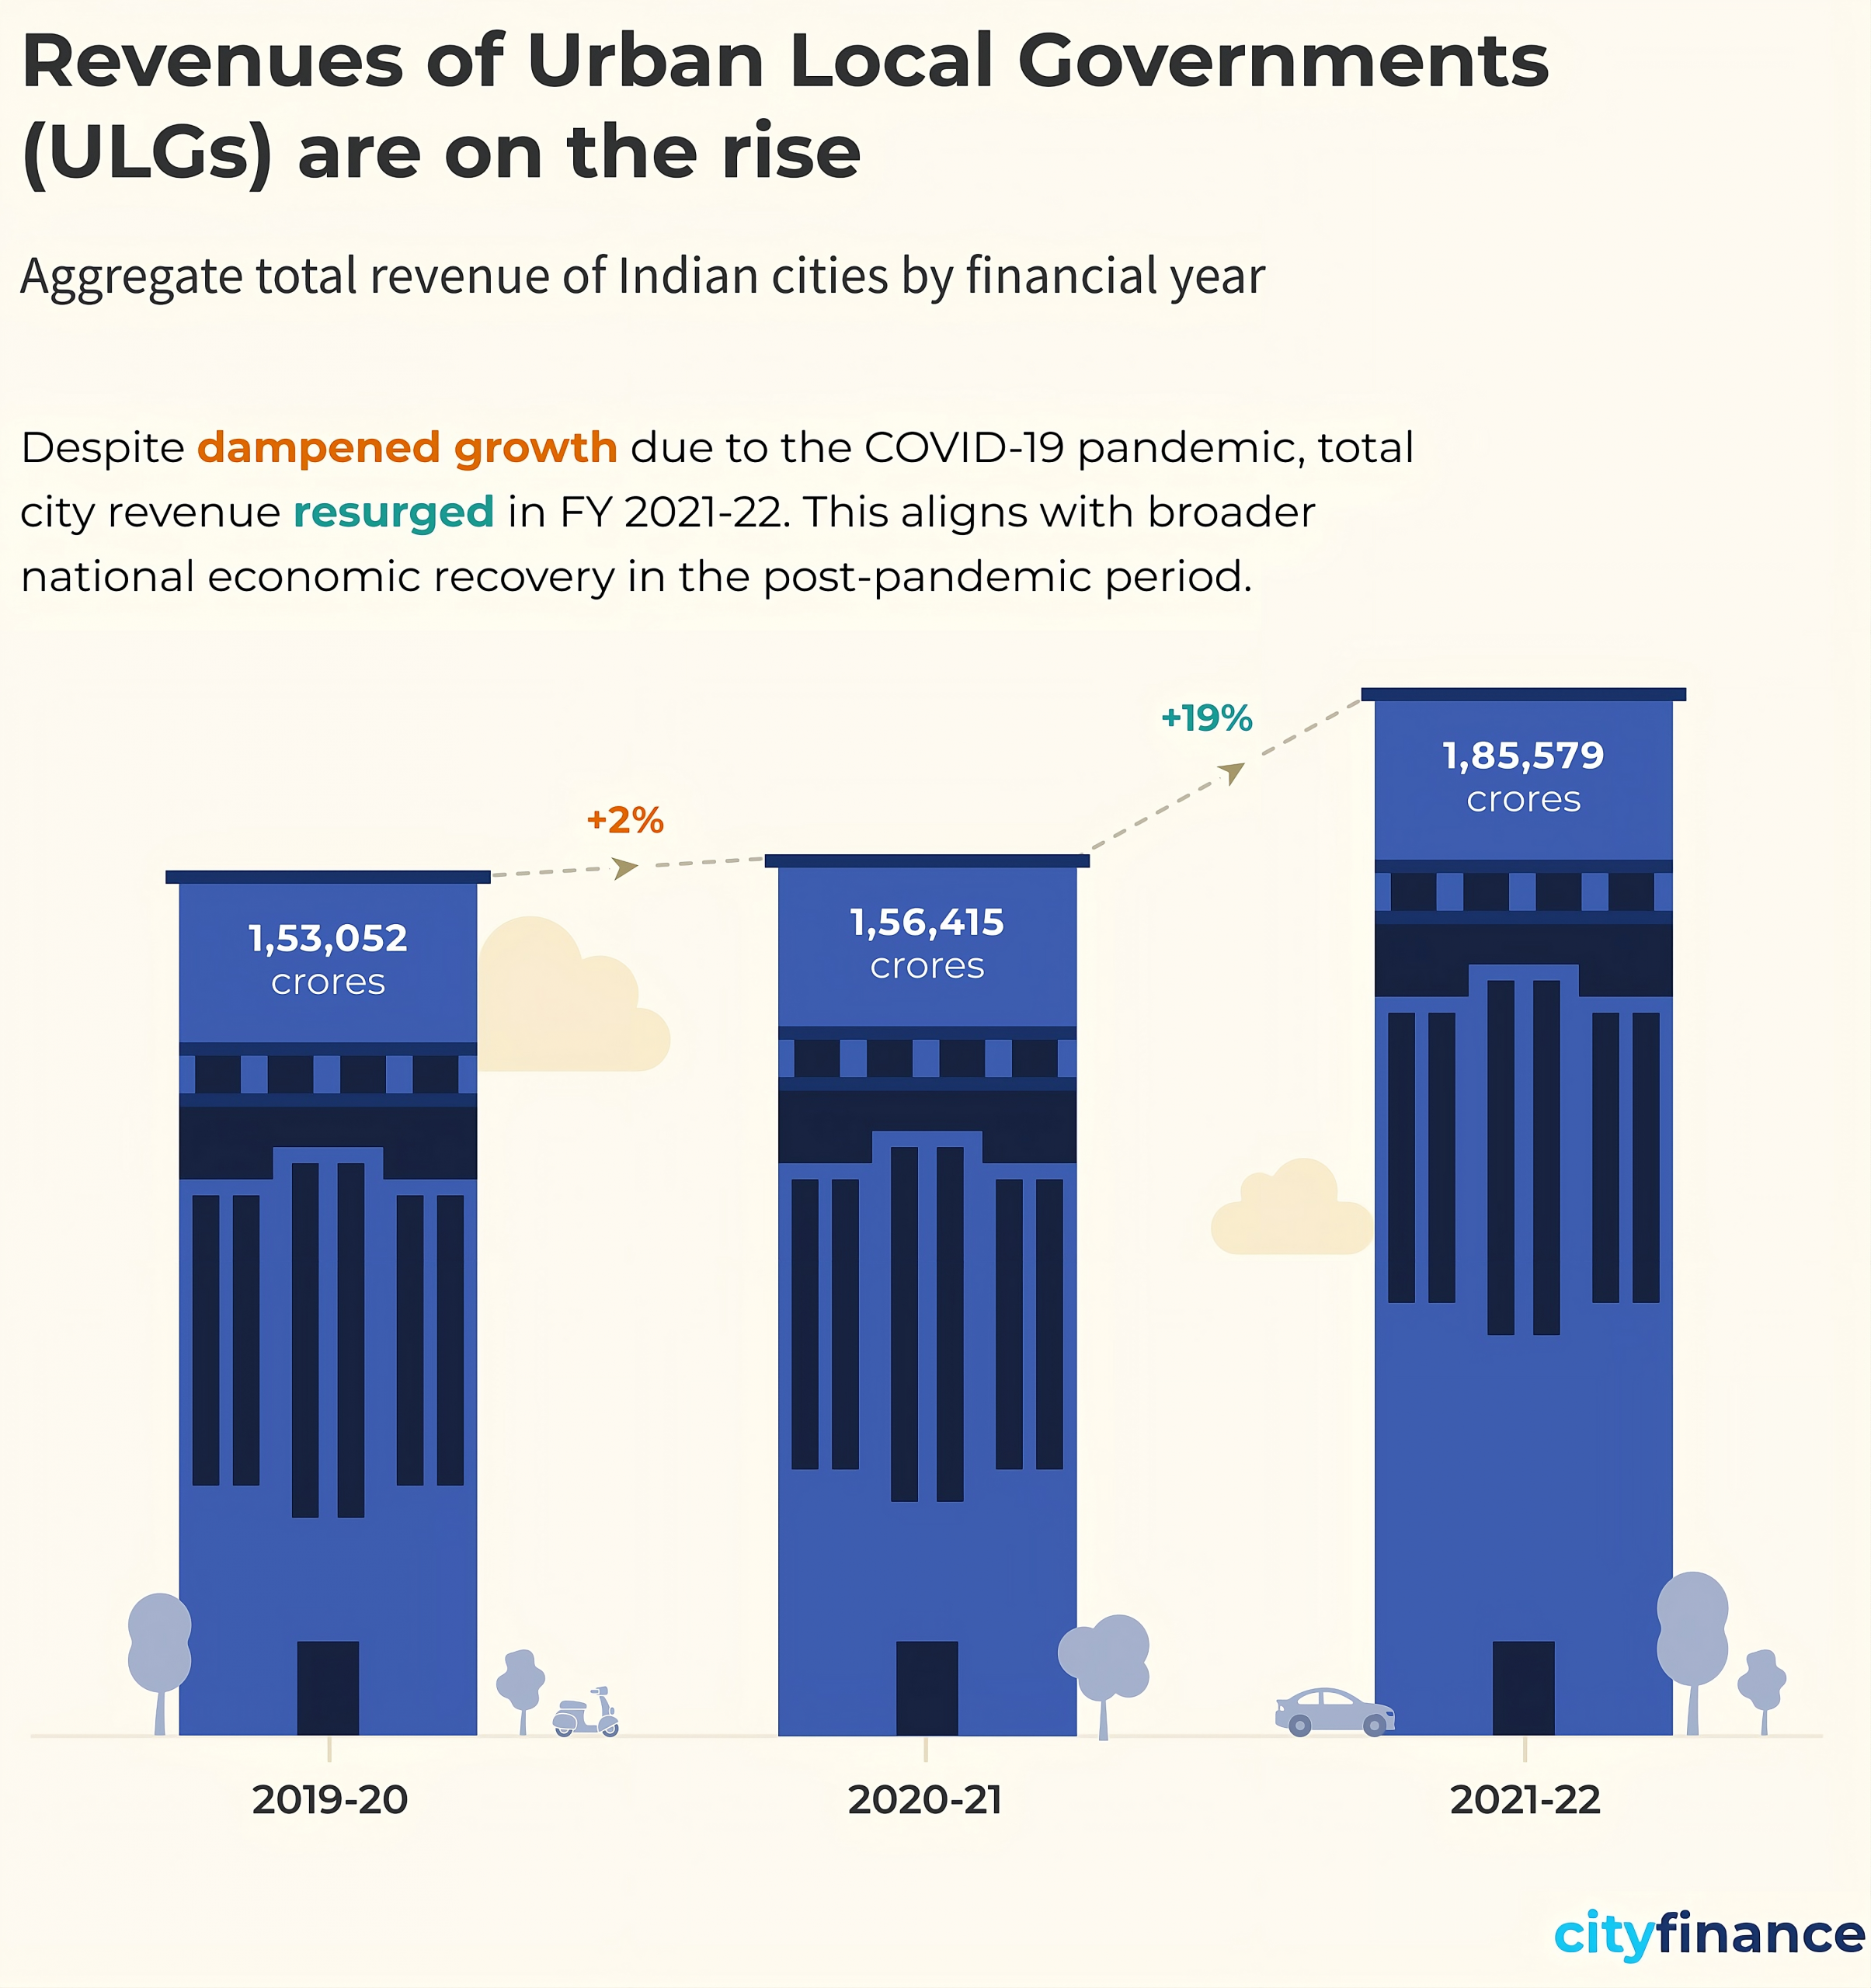
    Revenues of Urban Local Governments (ULGs) are rising across India, reflecting positive economic growth. However, this increase is far from uniform, with significant disparities emerging between cities.  

    As we see in the chart above, the 7 cities that serve 17% of the urban population of India report the largest share of receipts at 42%. In comparison, 3,374 cities that serve 41% of India’s urban residents form just 16% of total revenue. Could bigger cities simply have higher revenue because of their larger population base, or does the trend hold even when we look at per capita revenue? Let us examine. 

    Larger cities generate significantly more revenue per person, with cities in the 4 million plus population category collecting ₹15,542 per capita – nearly twice the next population category. This indicates that the revenue advantage of larger cities is not simply due to their larger population base but reflects genuinely higher per capita economic activity and tax collection capacity. 

    Growth rates (2020-21 to 2021-22) tell an even more interesting story: larger cities are not only generating more revenue, but they’re also growing faster than smaller cities. This widening gap indicates that smaller municipalities will require substantially greater support from central and state governments, through increased transfers, capacity-building initiatives, or targeted urbanization programs – to keep pace with the demands of rapid urban growth. Without such interventions, the revenue disparity between large and small ULGs is likely to deepen over time.  


    Big Cities Under the Lens: Who’s Leading the Way? 

    Now we know that India’s largest cities are at the forefront of the country’s growth trajectory, with their total revenues far exceeding those of smaller urban local governments. But as the graph below illustrates, there is considerable variation in total revenue even within these major cities.  

    While population size plays a critical role – Mumbai, as India’s most populous city, naturally generates substantial revenue, the disparity remains significant even when examined on a per capita basis. This suggests that factors beyond population, such as economic activity, tax collection efficiency, and administrative capacity, drive revenue differences among India’s largest cities. 

    Among the remaining large cities, Chennai reports the lowest total revenue at ₹3,255 crores. However, looking at per capita revenue, Hyderabad registers the weakest performance, with Bengaluru not far ahead. 

    These contrasts underscore the uneven fiscal capacity among major urban centres, shaped by differences in economic activity, administrative efficiency, local revenue mobilization patterns, and crucially, the extent of devolution of functions from state governments to ULGs.

    Ultimately, these figures highlight the importance of examining city finances through multiple lenses; both absolute and comparative metrics are essential to understanding the true fiscal health of India’s urban landscape. 


    Beyond the City: Mapping Revenue across States 

    Indian states vary significantly from each other in terms of level of urbanization, political environment, and institutional capacity. These factors significantly influence how cities generate and mobilize revenue. 

    The state-wise per capita revenue data reveals distinctive regional patterns across India. The most striking is the massive variation that exists across the country, ranging from Assam’s ₹1,525 to Maharashtra’s ₹18,115 – a more than tenfold difference in per capita revenue. Here, Maharashtra stands out dramatically as the highest per capita revenue generator, reflecting Mumbai’s economic dominance.

    Southern states demonstrate consistently strong performance, with Kerala (₹7,481), Karnataka (₹4,745), Tamil Nadu (₹4,191), and Telangana (₹3,741) all showing relatively high per capita revenues.

    Western states also excel, with Gujarat generating ₹5,839 per capita and Madhya Pradesh reaching ₹5,017. In contrast, northeastern states lag significantly behind, with Assam at ₹1,525 and Mizoram at ₹1,467 representing the lowest figures.  

    These disparities underscore that revenue generation capacity depends not just on urbanization levels, but critically on the extent of functional devolution and administrative powers granted to ULGs – more urbanized states don’t necessarily generate more revenue if their local governments lack adequate authority and resources.  


    Conclusion 

    This analysis reveals a stark reality: India’s urban revenue landscape is marked by significant concentration and growing disparities. Larger cities not only command the lion’s share of total revenue but also generate substantially higher per capita income and experience faster growth rates. Addressing this challenge requires recognizing that state-level decisions about revenue-sharing, functional devolution, and administrative autonomy critically shape urban fiscal capacity. We need to investigate these patterns further to understand how they extend beyond population size to economic activity, and administrative capacity.

    These widening gaps raise critical concerns about fiscal federalism and the sustainability of India’s urbanization trajectory. As revenue inequality between large and small cities increase, the challenge ahead involves both learning from high-performing cities and reforming state-level frameworks that govern urban finance. 

    Mumbai has emerged as a clear outlier throughout this analysis. Stay tuned for an analysis, where we dive deeper into what makes India’s financial capital such a revenue powerhouse. 

    Note: To ensure comprehensive representation and account for variations in data coverage and quality across cities, the figures presented are based on extrapolated financial data covering all 4,824 cities. Among these, 2,541 cities (approximately 60%) possess 3 years of contiguous data (2019–20 to 2021–22) in Cityfinance platform. Data from these cities have been systematically extrapolated using the ’per capita scaling methodology’ to reflect the financial performance of the complete set of 4,824 cities. Learn more about the extrapolation methodology here.